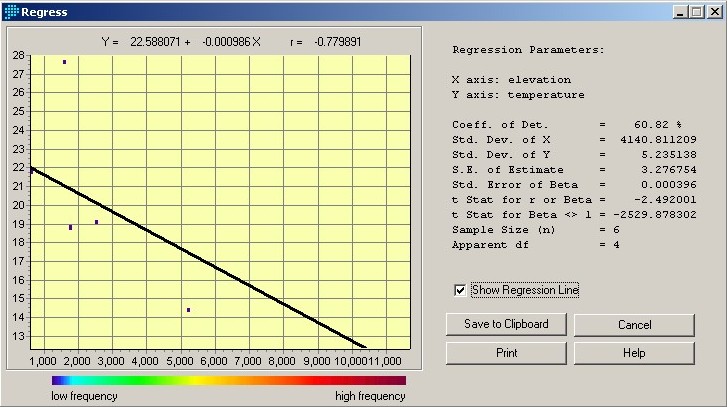
1) With the tabular data I collected from http://www.statlab.iastate.edu/soils/nssc/posters/hawaii.pdf , I created the following two value files.
| 1 | 27.0 |
| 2 | 18.8 |
| 3 | 14.3 |
| 4 | 12.3 |
| 5 | 18.7 |
| 6 | 21.5 |
| 1 | 1549 |
| 2 | 2506 |
| 3 | 5200 |
| 4 | 11700 |
| 5 | 1700 |
| 6 | 600 |
2) Using these two value files, I conducted a regression analysis to find the relationship between temperature and elevation with temperature and elevation as the dependent and independent variables respectively. This regression analysis resulted in the following equation: Y = 22.588071 - 0.000986 * X.

3) With the image calculator, I entered in the following:
[TEMP] = 22.588071 - 0.000986 * [HIDEM]
This produced the mean soil surface temperature (TEMP) raster image by using HIDEM as the elevation model.
4) I then reclassed the image showing areas with mean temperatures between 18.5 oC and 22.5 oC.
Main 1.0 Conceptual Outline 2.0 Data Collection 3.0 Methodology 4.0 Spatial Analysis 5.0 Methodological and Operational Problems