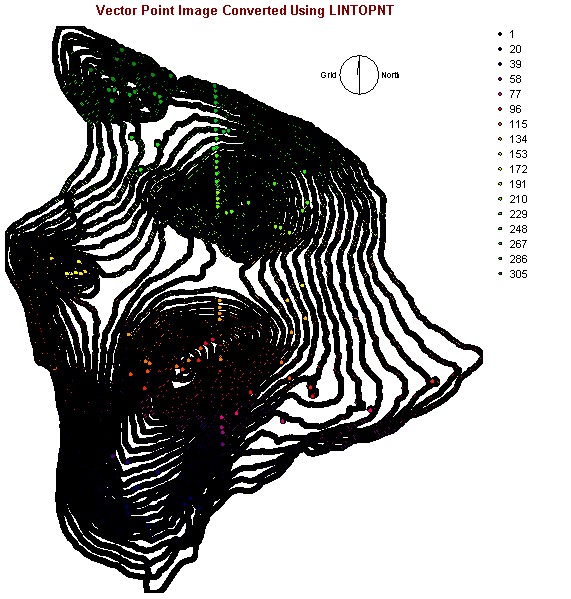
1) With the Hawaii elevation contours at 500 ft intervals (HICON500) line vector file, I converted it into a point vector file with LINTOPNT in Idrisi to create an image (HIPOINT).

2) Using this point vector file (HIPOINT) and TIN interpolation using points, I created a tin surface vector image (HITIN).

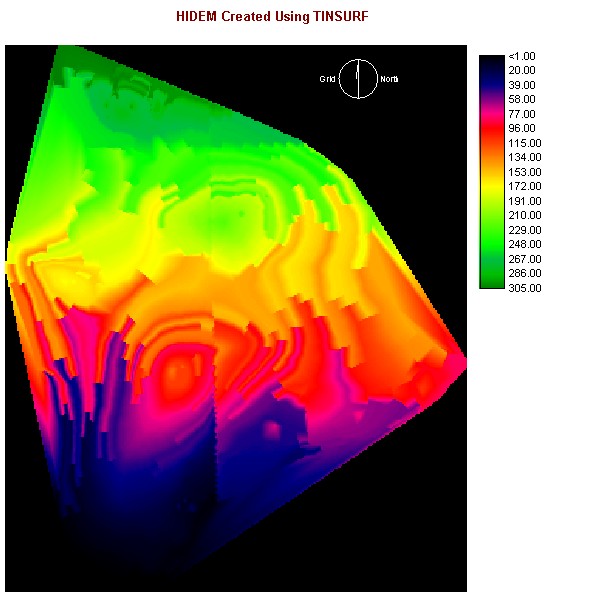
3) I then used the TINSURF module to create the DEM raster image for Hawaii (HIDEM).

4) Now to create the slope image, I used the SURFACE function and applied the DEM (HIDEM) to create the SLOPE raster image.
5) I then reclassed the SLOPE image to produce SLOPEBOOL showing areas with slope less than 2.5 degrees.
Main 1.0 Conceptual Outline 2.0 Data Collection 3.0 Methodology 4.0 Spatial Analysis 5.0 Methodological and Operational Problems