
A Multi-Criteria Evaluation (MCE) using the Weighted Linear Combination (WLC) method for determining the relative importance of criteria was used to develop a habitat suitability index for the Tiger Salamander in the region surrounding Oliver, British Columbia. The MCE consisted of both constraints (2) and factors (7).
- Biogeoclimatic Zones
- Land-use
These two constraints were used because each of them limited the habitat range of the Tiger Salamander. The biogeoclimatic zones layer was first unzipped using WinRAR, a simple file compression/extraction program. The unzipped file was then converted from an ESRI e00 file using the "import from interchange file" tool in Arctoolbox to a shapefile. The resulting biogeoclimatic zone shapefile was then projected and clipped using the clip and project tool in Arctoolbox. The resulting image is projected using the UTM-10N projection and is clipped based on the Digital Elevation Model (DEM) of the exact region of interest. After the image was clipped and projected, it was imported into IDRISI using the shapefile to vector file conversion tool. The vector file was then converted into a raster image using the polyras module and a blank raster image of the exact study area. This file was then reclassed into suitable (value of 1) and nonsuitable areas (value of 0). The suitable areas were defined by areas that were within the Bunchgrass and Ponderose Pine biogeoclimatic zones. All others were considered unsuitable.
The land-use file followed a similar approach:
- Brought into ArcMap as a shapefile
- Projected using the project tool in Arctoolbox
- Clipped using the clip tool in Arctoolbox based on the same DEM of the exact study area
- Imported into IDRISI and converted from a shapefile to a vector file
- Converted from a vector file to a raster image using the polyras module and blank raster image of the exact study area.
- The landuse raster image was then overlayed with a waterbody raster image using the overlay addition function.
- The resulting image was then reclassed into suitable (value of 1) and nonsuitable areas (value of 0). Nonsuitable areas were urban/recreational areas and recently logged areas. All other areas were considered suitable.
For a cartographic model and ouputs of the above processes click here. It is important to note that the model only shows the steps that were conducted within IDRISI using Macro modeler.
- Distance from water
- Distance from roads
- Distance from highways
- Distance from urban areas
- Water body Size (Area)
- Slope
- Land-use
- Factor 1 - Distance from water - was created by merging all waterbody shapefiles from the TRIM Data within ArcMap. The merged layer was then projected, clipped, imported, and converted into a raster image in the same manner as the above constraints.
- Factor 2 - Distance from roads - was created in the exact same was as Factor 1.
- Factor 3 - Distance from highways - was created from the major roads layer in the ESRI Data and Maps 2003 - Canada. The layer was imported into ArcMap and then followed the same process of projecting, clipping, importing and converting into a raster image.
- Factor 4 - Distance from urban areas - was created after the land-use factor (Factor 7) had been projected, clipped, imported and converted into a raster image (same process as Factor 1). The land-use raster file was reclassed into urban/recreational (value of 1) and everything else (value of 0).
After Factors 1-4 had been converted into a raster image file, the distance module was applied to each factor. In the case of distance from roads, highways, and urban areas, the further the distance the greater the suitability. However, with regards to distance from water, the further the distance, the lower the suitability.
- Factor 5 - Water body Size (Area) was created using the same steps as in Factor 1, however, the areas of each polygon (water body) were calculated by putting the raster image through the area module.
- Factor 6 - Slope - was created by projecting the DEM file into the appropriate projection (UTM-10N) as it was imported into IDRISI. The slope module was then applied to the properly projected DEM file and the measurements were kept in degrees.
- Factor 7 - Land-use - The land-use file was separated into different layers based on land-use ID after being projected and clipped to the appropriate dimensions. This was done by opening the attributes table and selecting polygons based on land-use ID. A layer was created for each land-use ID and exported as a shapefile. It was then imported into was IDRISI and converted into a raster image by the same process used in Factor 4. The eight resulting images were then reclassed into seven landuse types (Urban/Recreational Area, Recently Logged, Old Forest, Young Forest, Agriculture, Rangelands, Wetlands - in order of increasing suitability).
A Cartographic model, outputs and detailed description of the process used to create the factors can be found here. Similar to the constraints model, the model does not show the steps taken within ArcMap.
Summary of the processes applied to produce the fuzzy outputs of each factor (All three scenarios)
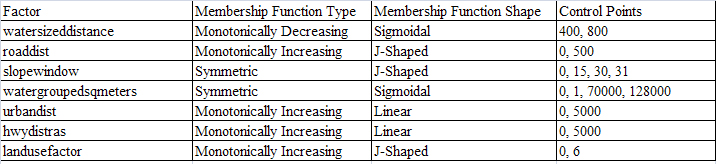
Early Spring Scenario
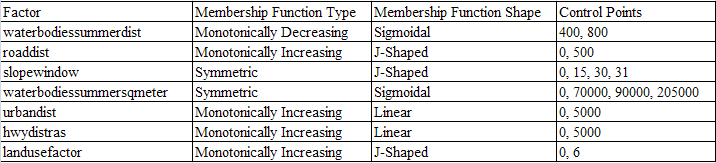
Late Summer Scenario
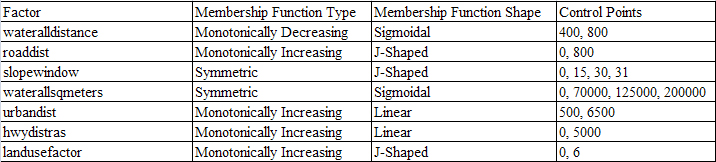
Climate Change/Population Growth Scenario
A monotonically decreasing function was chosen for the distance to water factor because the movement away from water decreases the suitability of habitat for terrestrial Tiger Salamanders. A monotonically increasing function was used for the distances from roads, highways, urban centers, and landuse. In the case of roads, highways and urban centers, movement or distance away from these features increases the suitability of the land for the Salamander. The landuse factor used a monotincally increasing function because the land use types were reclassed a given values of 0 through 6 with 6 being the most suitable.
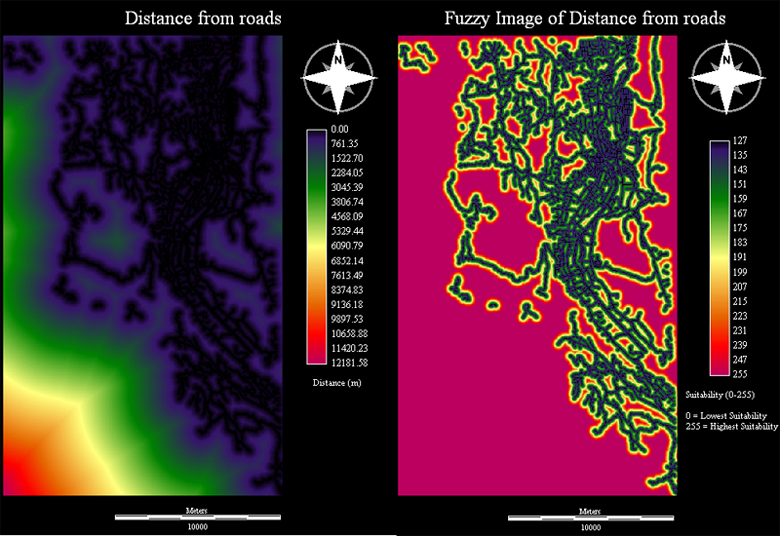
The picture below shows the results of a distance operation applied to the roads raster file (left image). The right image shows the distance from roads file after it has gone through the fuzzy module in the MCE. All other factor outputs can be found here.