


. D A T A . A C Q U I S I T I O N . & . M A N I P U L A T I O N .
Programs used:
Microsoft Excel 2003
ArcMap 9.1
Other:
World Wide Web
Data collected for this project were obtained from the Data Warehouse in the S drive. The same projected coordinate system and geographic coordinate system was used for all maps.
Projected Coordinate System: NAD_1983_UTM_Zone_10N
Geographic Coordinate System: GCS_North_American_1983
gvrd_2001_landuse shape file:
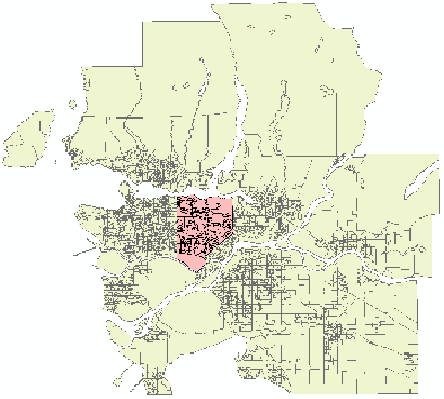
Figure 11 - GVRD
After aquiring the shape file of the GVRD, I manipulated it in ArcMap where I extracted the City of Burnaby only. With this shapefile, I further manipulated all of my factors and constraints by clipping them to this extent.
Min X - 498244.375
Max X - 507829.375
Min Y - 5447568
Max Y - 5460288
Landuse - After aquiring data from the S drive I imported it into ArcMap where I extracted out the Cityof Burnaby. In this program, I converted my shape file into raster and clipped it to the extent of Burnaby map as mentioned above. After my coordinates were matched up, I converted my raster shape file into ASCII so that it would be easier to read in IDRISI. I chose to use landuse because I wanted to factor out areas that were in commercial zones, commercial/residential mixed zones and high-rise residential zones.
Population Density - Data was collected from the S Drive in one of the Geography 351 course folders. With this data, I was able to extract information on total population in different areas throughout the city.
Transportaion - All of the data regarding transportation around the city such as skytrain stations, bus routes and major roads was found in the S drive where it was imported in the ArcMap and manipulated and coverted in ASCII.
Coffee Shops - I gathered information online on all the existing coffee shops in Burnaby. I then geocoded all the addresses using an online geocoder and inputed the data into an excel spreadsheet. After saving my files into a dbf format, I imported it into ArcMap where I displayed it ontop of a Burnaby landuse map to see where the approximate locations were. From this map, I was able to see that there were a lot coffee shops located in the Burnaby Heights area on Hastings Street and the Metrotown area on Kingsway Street.
Institutions - Like how I found data for coffee shops, I searched online for all the local college and universities. The only major university that exists in this city is Simon Fraser University, but I also wanted to include the smaller institutions where I know there would still be students studying regardless of which institution they attended. After projecting and clipping my shape file, I noticed a large handful of institutions were clustered on Kingsway Street in the Metrotown area.