The objective of cluster analysis is to reduce a large data set to smaller numbers of groups, or to divide the study area into sub-regions. K-Means clustering is a non-hierarchical clustering method in which the number of clusters is specified initially. Starting with k random clusters, data points are moved between those clusters with the goal to minimize variability within clusters and maximize variability between clusters.
In ArcView, the Enumeration Areas (EA) are classified and mapped with their corresponding cluster membership from K-Means clustering. Interpretation of results can be done through examining the mean of the cluster variables for each cluster ID and identifying the location of cluster ID in the study area.
Cluster Combination One
Variables selected for this cluster combination were: male population, female population, Aboriginal population, average 1995 income, and migrants. Six clusters are chosen initially, and the resulting cluster sizes corresponding to the cluster membership are 100, 56, 171, 201, 11, and 53.
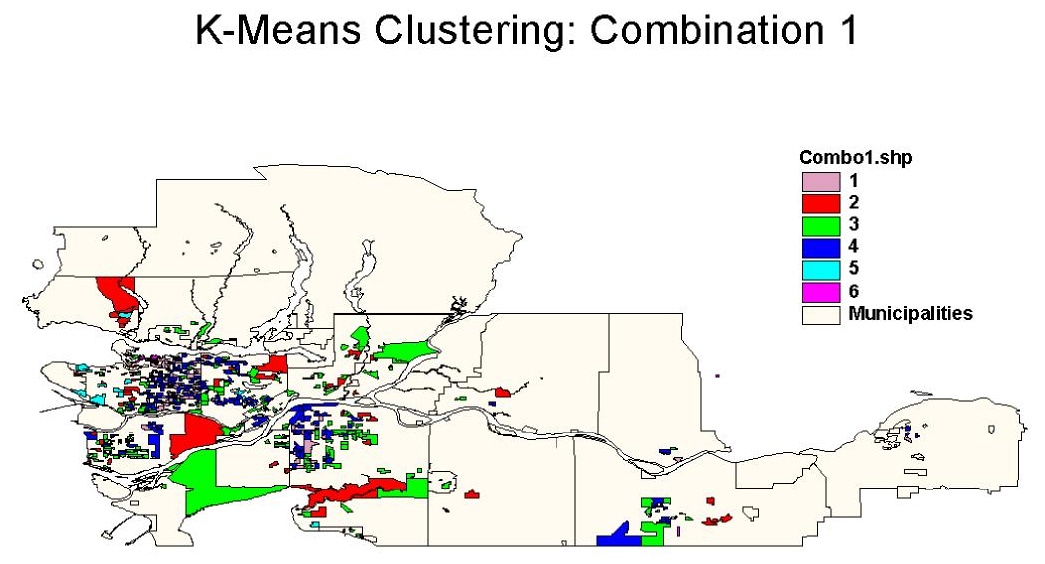
Cluster ID 1 has high values for all five of the cluster variables. The EAs with Cluster ID 1 interweave with the EAs containing Cluster ID 4 in Vancouver East and Surrey. Cluster ID 4 has the most number of EAs (201) and the EAs with this cluster membership are concentrated in Vancouver East, Burnaby, Richmond and Surrey. The mean values of all the cluster variables for Cluster ID 4 are similar to those for Cluster ID 3. The EAs with Cluster ID 3 and 4 both have high number of male population, female population, migrants and moderate number of Aboriginal population. The major difference between Cluster ID 3 and 4 is that the average 1995 income for EAs with Cluster ID 3 is greater. In total, Cluster membership 3 and 4 account for 373 out of 592 EAs.
Cluster ID 2, 5, and 6 have relatively low numbers of membership. EAs with these cluster memberships have relatively low numbers of male population, female population, and migrants. Cluster ID 5 and 6 have zero for the average 1995 income due to numerous missing values for this variable in the data set.
Based on the cluster variables and the number of clusters selected, the following image shows that clustering of the EAs with TB cases tend to be located in Vancouver, Burnaby, Richmond, and Surrey. There is also some minor clustering of EAs in the suburban areas characterized by Cluster ID 2 and 3.
Map of EAs with Their Cluster Membership from K-Means Clustering Combination 1
Cluster Combination Two
Variables selected for this combination were: South Asian, Chinese, Korean, Japanese, South East Asian, Philippino, International migrant, intraprovincial migrant, interprovincial migrant, external migrant, and migrant. Three clusters are chosen initially, and the resulting cluster sizes corresponding to the cluster membership are 45, 373, and 174.
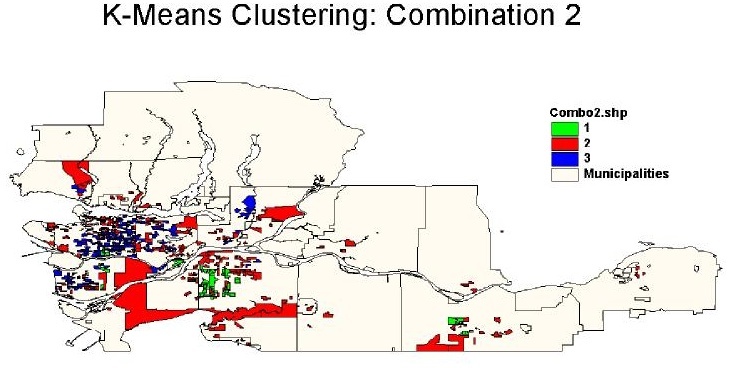
Cluster ID 1 is characterized by the highest amount of South Asians, Philippinos, international migrants, intraprovincial migrants, and the lowest amount of Chinese, Koreans, and Japanese. The EAs with this cluster ID are located in Surrey and Langley.
Cluster ID 2 has the lowest amount of South Asians, South East Asians, Philippino, external migrants, migrants, low amounts of Chinese, Koreans, Japanese and relatively low amounts of international migrants & intraprovincial migrants. The EAs with cluster ID 2 are located in North Vancouver, West Vancouver, Vancouver West, Downtown Vancouver, Coquitlam, and Abbotsford.
Cluster ID 3 has the highest amount of Chinese, Koreans, Japanese, South East Asians, external migrants and lowest amount of international migrants, intraprovincial migrants, interprovincial migrants. The EAs with Cluster ID 3 are located in Vancouver East and Richmond.
Vancouver and Richmond share the same Cluster ID, Surrey forms its own cluster ID, and the rest of the EAs belongs to another Cluster ID. If K-Means clustering is based on ethnicity and immigration-related variables, the clustering pattern will be different.
Cluster Combination Three
The variables selected for clustering were: total population, number of persons in the labour force, number of males and females using public transit. Three clusters are chosen initially, and the resulting cluster sizes corresponding to cluster membership are 281, 111, and 200. This combination of cluster variables yields a more balanced number of EAs in each cluster ID.
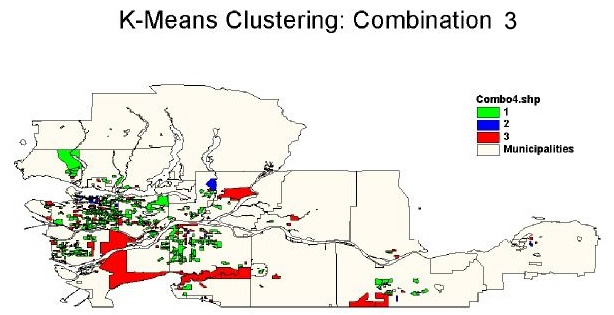
Most of the EAs have Cluster ID 1, and membership in this cluster ID implies high values across the four cluster variables. EAs with Cluster ID 1 are mainly distributed in Vancouver, Burnaby, Richmond, Surrey, Mission, and Abbotsford.
Cluster ID 2 is characterized by low values across all the four cluster variables - i.e. low number of total population, number of person in labour force, males and females using public transit. EAs with this cluster ID are located in Vancouver Downtown, Downtown Eastside, and Gastown. Cluster ID 3 has intermediate values across all the four cluster variables, and EAs with this cluster ID are located in Delta, Surrey south, Mission, and Abbotsford.
It is visible that the three EAs with Cluster ID 1 are quite spatially homogenous. This pattern of clustering in Vancouver, Burnaby, Richmond, and Surrey belongs to the same cluster membership, and is similar to the pattern observed in cluster combination 1.


