Spatial Statistical
Analysis:
Point Pattern Analysis
Nearest Neighbour Analysis
Nearest neighbour analysis compares the observed
average distances between nearest neighbouring points and those of a known
pattern. The nearest neighbour statistic, or the R-scale, is calculated by
dividing the observed average distance between nearest neighbours by the expected
average distance between nearest neighbours. The R scale ranges from 0 (completely
clustered) to 1 (random) to a maximum of 2.149 (completely dispersed).
Ordered neighbour statistics were calculated for
each of the municipality to test whether the point pattern, i.e. the spatial
distribution of TB cases, is dispersed, random, or clustered. Four statistical
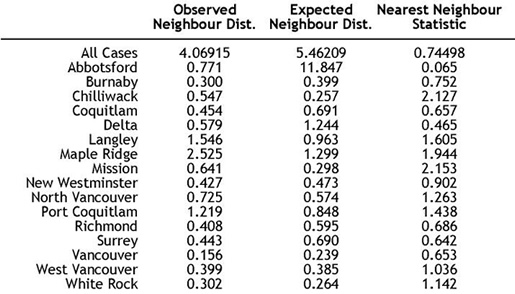
values were generated for each municipality in the table below: 1) Observed
neighbour distance, 2) Expected neighbour distance, 3) The nearest neighbour
statistic, and 4) The standardized Score.

If Nearest Neighbour Analysis is applied to all
the TB cases in the study area, the observed neighbour distance is 4.07 and
the expected neighbour distance is 5.46. This results in a nearest neighbour
statistic of 0.74 - the point pattern is more clustered than random. However,
since the ZR is in between -1.96 and +1.96 (the critical values at the 0.05
significance level), the observed pattern is not significantly different from
a random pattern. The disadvantage of analyzing the entire point pattern at
the same time is that clustering at the local scale is undermined.
The following municipalities have a Nearest Neighbour
statistic falling between 0 and 1, which indicates that the spatial distribution
of TB cases in these municipalities is more clustered than random. They are
listed in increasing level of clustering:
- New Westminster (0.902)
- Burnaby (0.752)
- Richmond (0.686)
- Coquitlam (0.657)
- Vancouver (0.653)
- Surrey (0.642)
- Delta (0.465)
- Abbotsford (0.065)
Ordered neighbour statistics are also applied to
four clusters identified on the basis of distinct genetic fingerprints. While
these cases are genetically clustered, it is important to discern whether
or not they are also spatially clustered. Ordered neighbour statistics were
applied to point patterns with Cluster ID 13, 14, 33, 35, and the point pattern
with no cluster ID.

Cluster ID 14, which has 9 cases, is the most clustered, as indicated by a
Nearest Neighbour Statistic of 0.218. Having a Nearest Neighbour Statistic
between 0 and 1, Cluster IDs 13, 33, and 35 also show a more clustered than
random point pattern. But for Cluster ID 33, because its Z score is within
the range of -1.96 and +1.96, the observed point pattern is not significantly
different from a random pattern (assuming a 0.05 significance level). For
observations with no cluster ID, the pattern is also more clustered than random
since the observed neighbour distance is less than the expected neighbour
distance and the Nearest Neighbour Statistic is less than 1.
Quadrat Analysis
Quadrat analysis examines the change in density
of point pattern over space to see whether the spatial distribution is more
clustered or dispersed than a theoretically constructed random pattern. By
overlaying the study area with a regular square grid, the frequency distribution
of the number of squares with a given number of points can be calculated.
The variance-mean ratio (VMR) is used to standardize
the degree of variability in cell frequencies relative to the mean cell frequency.
Thus, a random point pattern would have a VMR of 1 or very close to 1. If
an observed point pattern has a VMR of greater than 1, then it is more clustered
than random. If an observed point pattern has a VMR of less than 1, then it
is more dispersed than random. Other than comparing the ratio to 1, the difference
has to be standardized by the standard error in order to determine if the
standardized score of the difference is larger than the critical value (1.96
at the 0.05 level of significance).
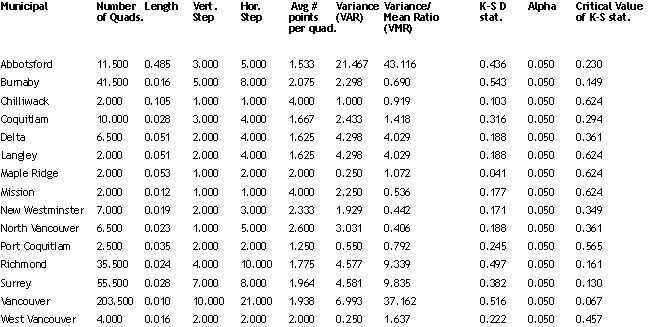
Municipalities with a more clustered than random
TB spatial distribution are Abbotsford, Coquitlam, Delta, Langley, Maple Ridge,
Richmond, Surrey, Vancouver, West Vancouver, and White Rock. In particular,
the TB cases in Abbotsford and Vancouver are highly clustered as indicated
by their extremely large VMR.

Quadrat Analysis Results for TB Point Pattern in All Municipalities
The Kolmogorov-Simirnov test, or the K-S D statistic, is used to statistically
test the difference between an observed frequency distribution and a theoretical
frequency distribution. If the calculated D is greater than the critical value
of D at the same level of alpha, then the two distributions are significantly
different statistically, i.e. the observed pattern is significantly different
from a dispersed pattern. The TB point pattern in the following municipalities
has a K-S D statistic of greater than the critical value, which implies that
the point pattern is not dispersed: Abbotsford, Burnaby, Coquitlam, Richmond,
Surrey, and Vancouver.
For some municipalities, the K-S test and the variance-mean
ratio yield inconsistent results. In the case of Burnaby, VMR is less than
1 (pattern is more dispersed than random) but the K-S D statistic is greater
than the critical value (pattern is significantly different from dispersed
pattern). Because the K-S test is based upon weak-ordered data while variance-mean
ratio is based upon an interval scale, the variance-mean ratio tends to be
a stronger test (Lee and Wong, 2000, 69).
Previous
- Next
Methodology
& Analysis
Visualization | Demographic
Profiling | MCE | Spatial
Statistics [ 1 2 3
4 ]
Home
| Introduction | Background
Objectives | Data
| Analysis | Error | Conclusions
Links | References
| Contact


