Visualization

Base Maps

Georeferenced point data of TB cases was brought into a variety of GIS software packages - ArcView, ArcGIS, and Idrisi32. Vizualization techniques such as geo-demographic profiling were not employed to produce all visual output maps, with certain maps produced to be strictly used as a visualization of the cleaned dataset.

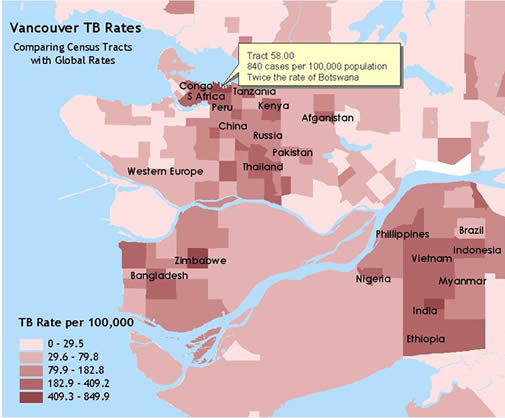
In order to provide a sense of the how tuberculosis rates in specific areas in the Greater Vancouver region compared to national incidence rates of countries with TB epidemics, a map was created comparing TB rates to the national rates of countries with epidemic-proportions of TB infection. By projecting the number of tuberculosis patients in each census tract, normalized by the size of the population in the 1996 Canadian census, it is easy to visualize the areas with higher than average tuberculosis rates. Using knowledge obtained from the World Heath Organization (2002), different areas were linked to national rates in various parts of the world.
One important focus of the BC Centre for Disease Control's (BCCDC) TB research initiative was documenting the movement individual genetic strains of tuberculosis. Individual strains can be used to trace tuberculosis passing from one individual to another. In the GVRD dataset, 47 genetic clusters were documented between 1995-1999. Of these, the size of clusters ranged from those only two in individuals each (total of 33 two-person clusters), to a cluster containing 18 individuals. Simply isolating the clustered individuals from the rest of the dataset produced the map below, depicting the largest cluster of 18 individuals.

Surfaces

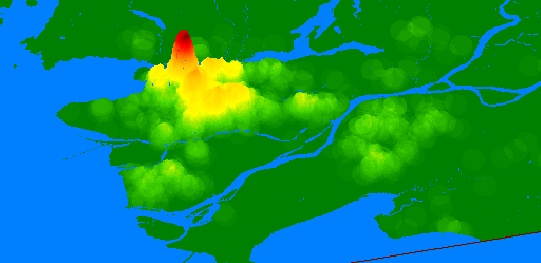
Three-dimensional (orthographic) surfaces were also created for the purposes of visualisation, although their utility may be limited by the perspective or angle at which the data surface is presented. Many regions, for example, may be obscured behind ridges or spikes in a single image, and even multiple imagery orientation would not wholly ameliorate this problem. An ideal surface visualisation is rendered in three dimensions (or, more accurately, 2.5), in which the user dynamically adjusts the height and angle of the surface view.

Unfortunately, such dynamic adjustment of viewing angle relative to the surface was not possible due to time and software constraints, and as a result a small number of surfaces were created and are included here if only to show the significance of observation agglomeration in the Downtown Eastside.

The surface shown below is one of many produced in Idrisi32 using the ORTHO module. The surface values themselves were generated from a density field of tuberculosis cases developed using ArcView Spatial Analyst. Various raster files were draped over the surface, including a land use raster file, and a simple "elevation" raster file designed to add colour differentiation to different elevations. The spike in TB incidence representing Stratchona dispalys the concentration of tuberculosis in this low socio-economic neighbourhood.


Methodology & Analysis
Visualization | Demographic Profiling | MCE | Spatial Statistics


Home | Introduction | Background
Objectives | Data | Analysis | Error | Conclusions
Links | References | Contact