| |
||||||
| |
|
|||||
|
|
|
|
||||
| |
|
|||||
| |
|
|
|
|
||
| |
|
|||||
SPATIAL ANALYSIS
|
Part A: Socio- economic Factors |
||||
 |
||||
|
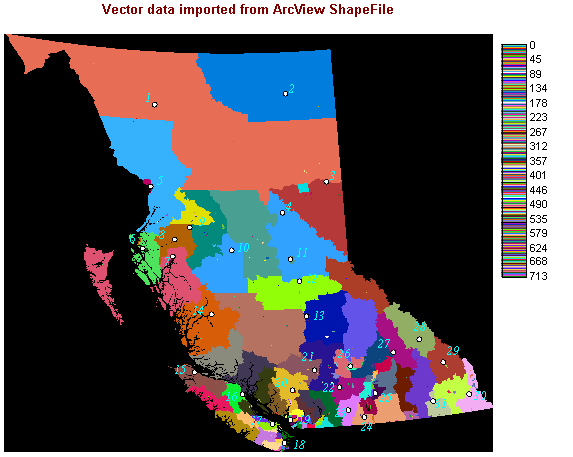
This is a base map of the part A.
|
||||
 |
||||
|
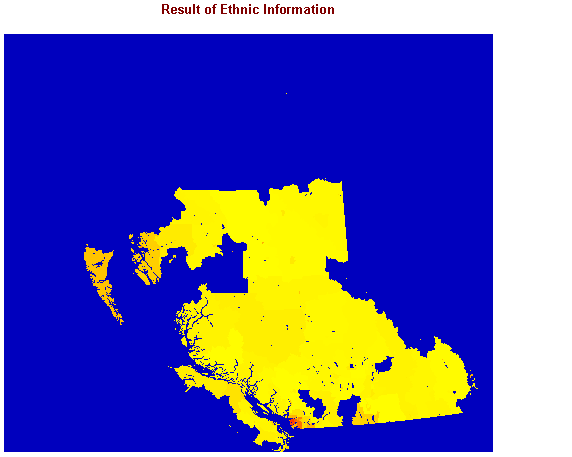
The result of the ethnic information red ----> yellow |
||||
 |
||||
|
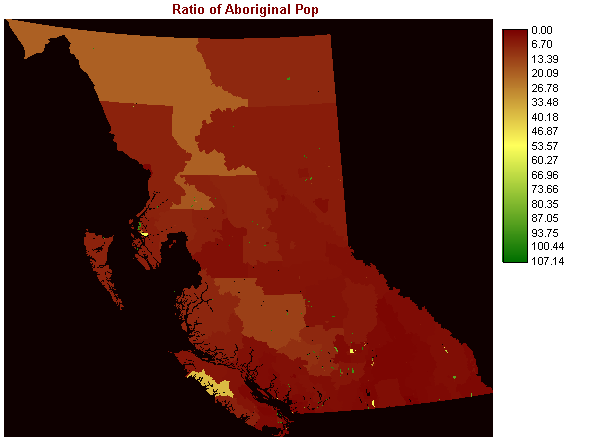
The ratio of the Aboriginal population |
||||
 |
||||
|
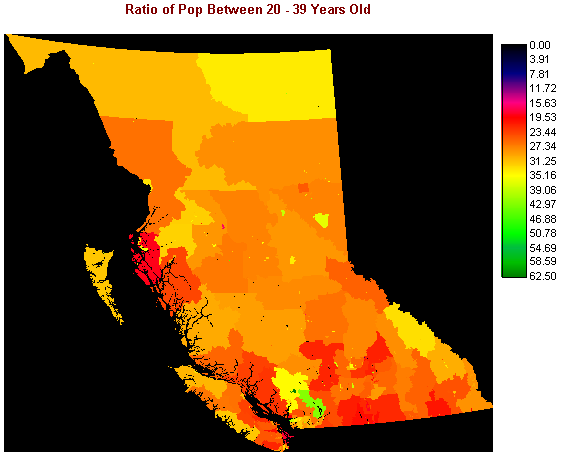
The ratio of the population of the age between 20 and 39. |
||||
 |
||||
|
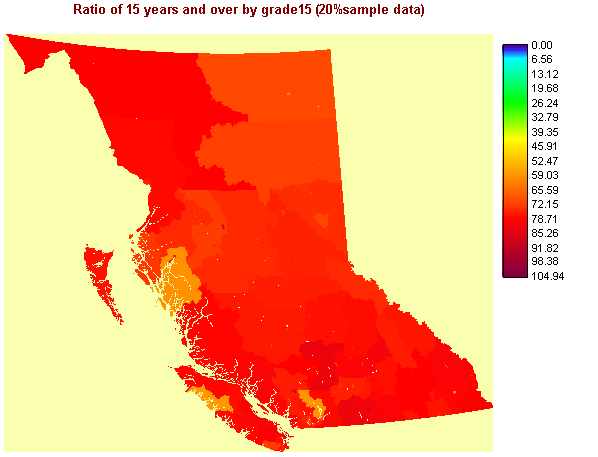
The ratio of People (15 years over) who attended the school up to grade
15 |
||||
 |
||||
|
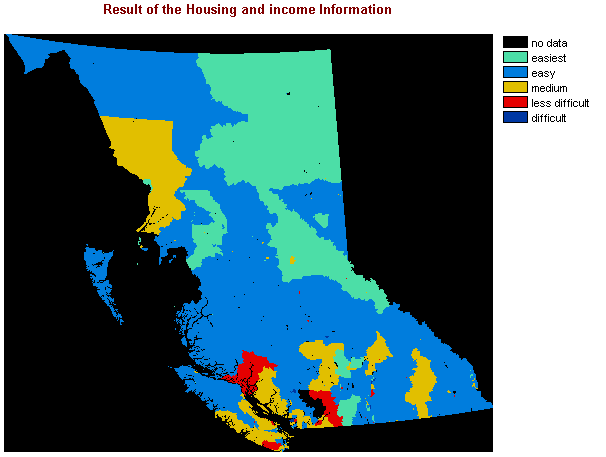
The result of the housing and income information It shows the degree of the financial difficulties. |
||||
 |
||||
|
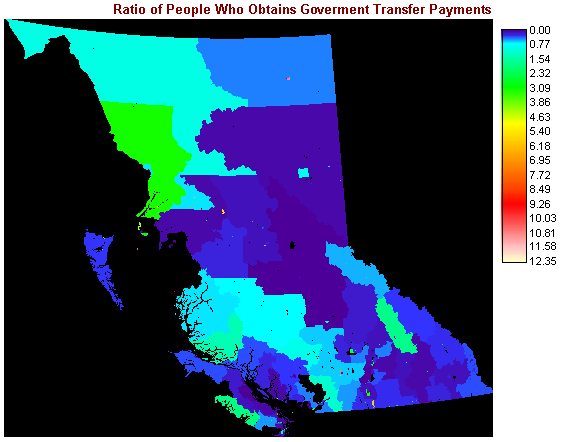
The ratio of People who obtain the government transfer payment. |
||||
 |
||||
|
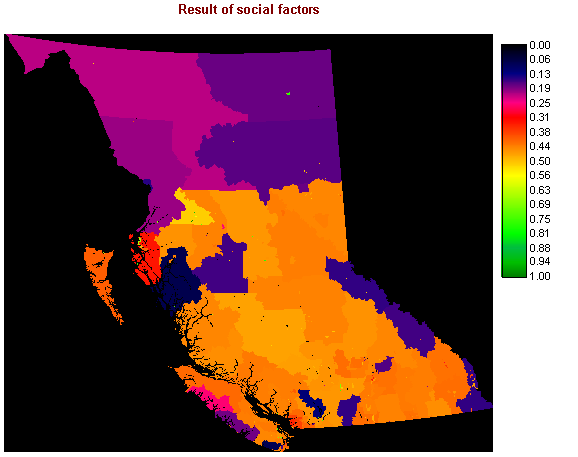
The result of the socio-economic factors. |
||||
|
Part B: Health Related Factors
|
||||
|
The base map of the part B |
||||
 |
||||
|
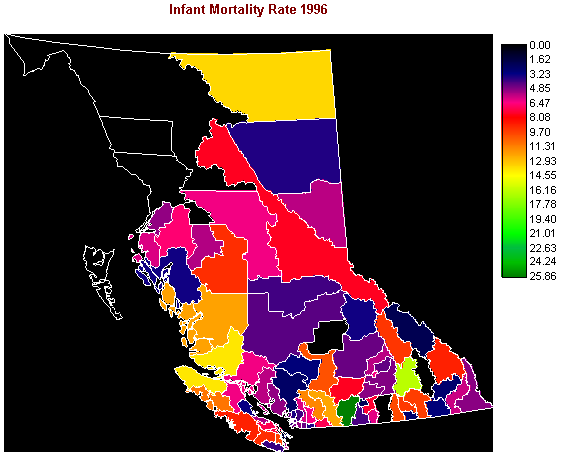
Infant Mortality Rate 1996 Princeton area is the highest rate. (dark green) |
||||
 |
||||
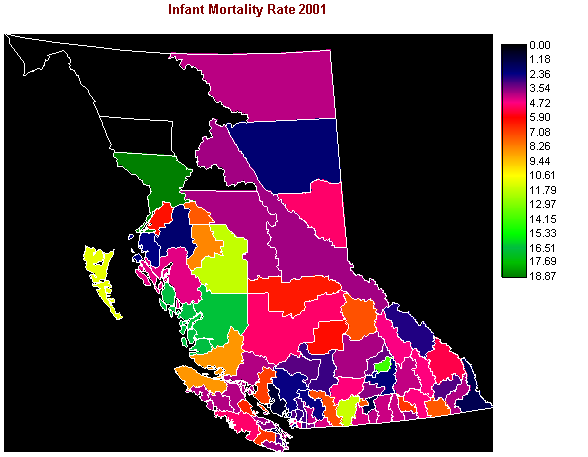
| Infant Mortality Rate 2001
Snow country area is the highest rate. |
||||
 |
||||
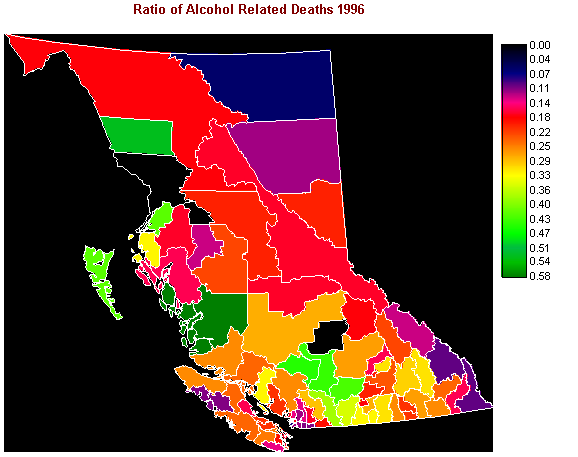
| The ratio of the alcohol related
deaths 1996
Central Coast and Bella Coola areas have the highest ratio. |
||||
 |
||||
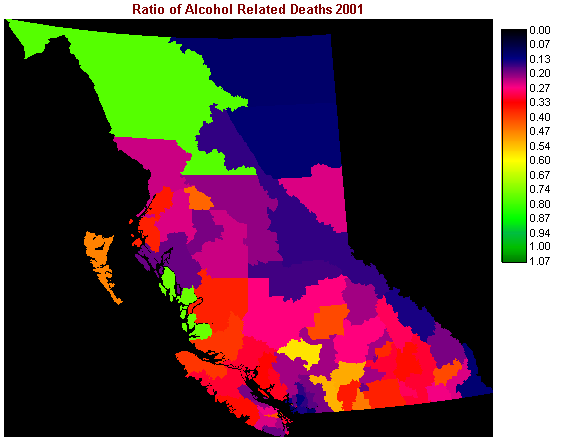
The ratio of alcohol related deaths 2001 Bella Coola is again at high ratio. |
||||
 |
||||
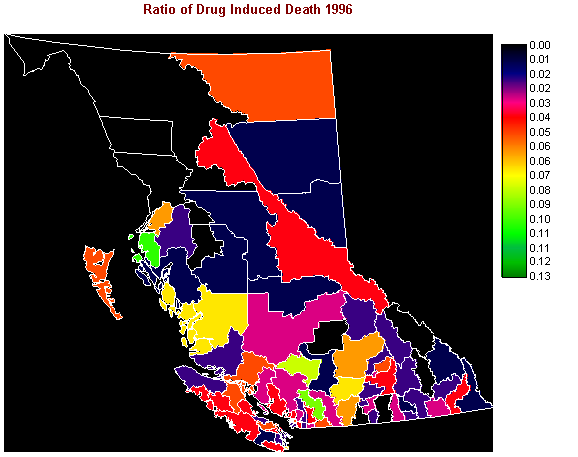
| The ratio of drug induced deaths
1996
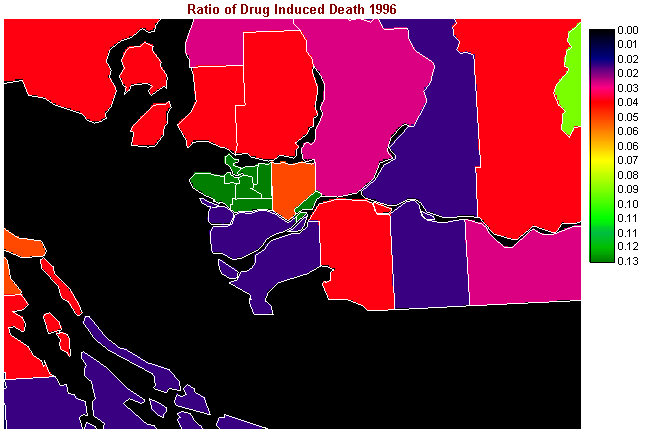
Vancouver is highest. |
||||
 |
||||
| Zooming into the image for Vancouver
area. |
||||
 |
||||
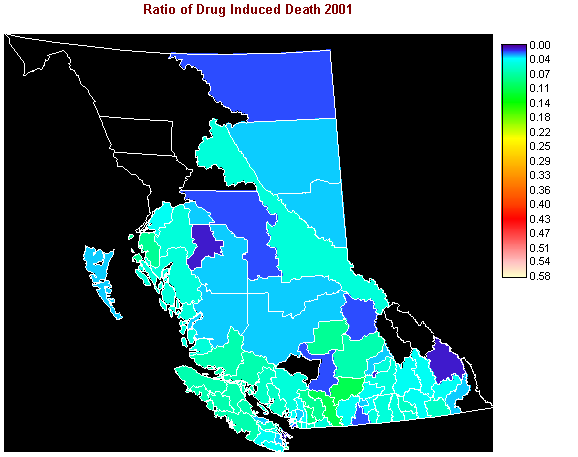
| The ratio of drug induced deaths
2001
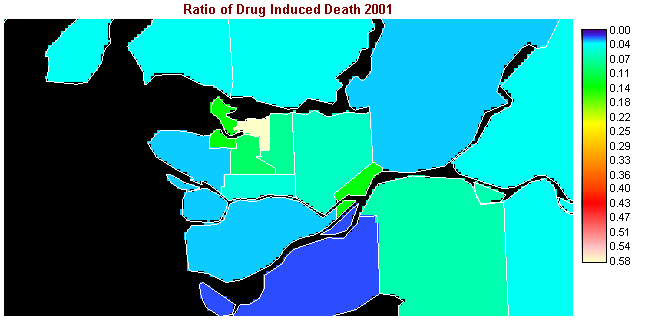
Vancouver Eastside has the highest ratio. |
||||
 |
||||
| Zooming into the image for Vancouver
area. |
||||
 |
||||
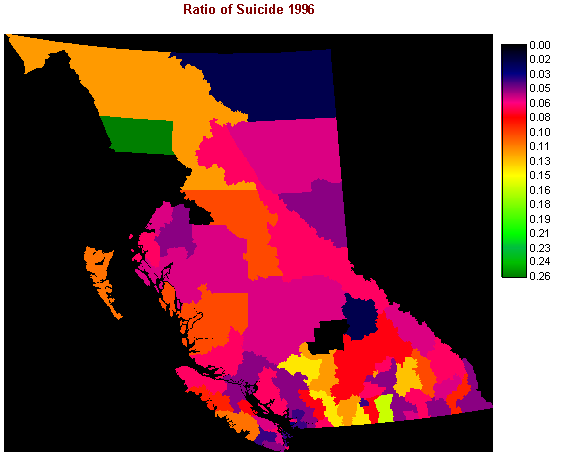
| The ratio of suicide 1996
Telegraph Creek has a high ratio. |
||||
 |
||||
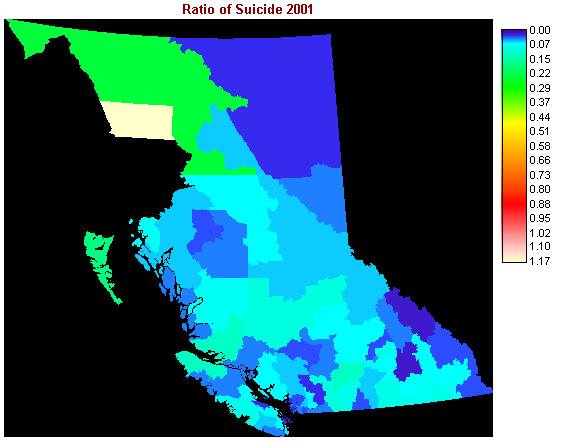
| The ratio of suicide 2001
Telegraph creek has again at high ratio. |
||||
 |
||||
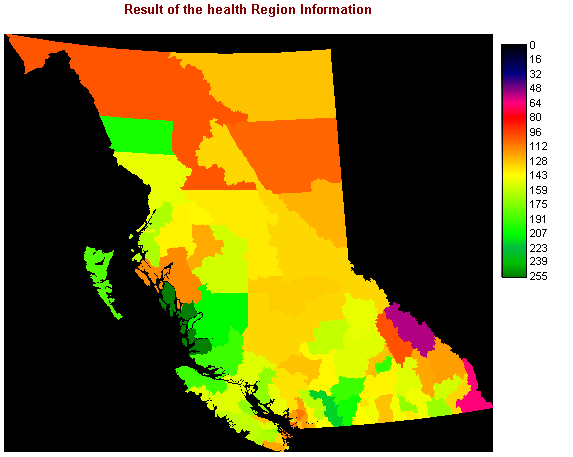
| The result of the health related
factors. |
||||
 |
||||
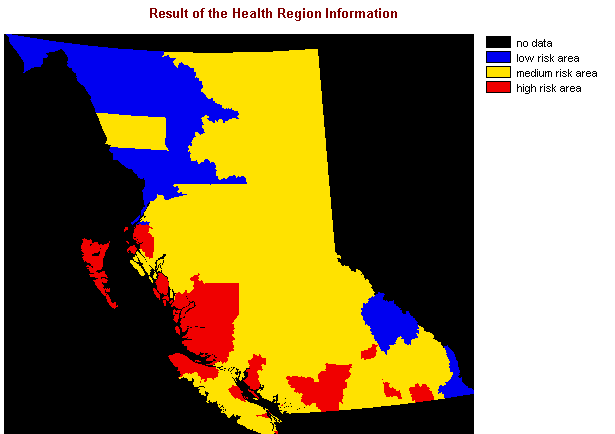
| I reclassified the result. Central Cost area, some area of Fraser and Okanogan area are at high risks. |
||||
BACK --------- HOME --------- NEXT
| |
||||||
| |
|
|||||
|
|
|
|
||||
| |
|
|||||
| |
|
|
|
|
||
| |
|
|||||