| |
||||||
| |
|
|||||
|
|
|
|
||||
| |
|
|||||
| |
|
|
|
|
||
| |
|
|||||
CONCEPTUAL IDEA
|
|
Based on five categories that I have chosen in the previous section,I partitioned those factors. Part A: socio-economic factors In part A and B I build models and create result A and B. In the end of the analysis, I will combine (WLC) the result of A and
B to get a result of my project. |
|
 |
||
|
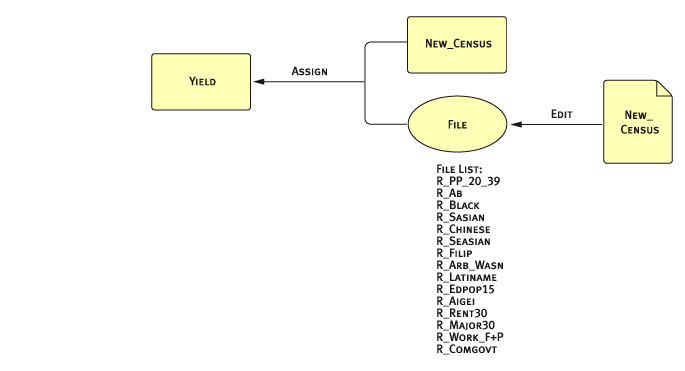
Converting a vector image to a raster one. |
||
 |
||
|
Creating 15 layers of social factors. |
||
 |
||
|
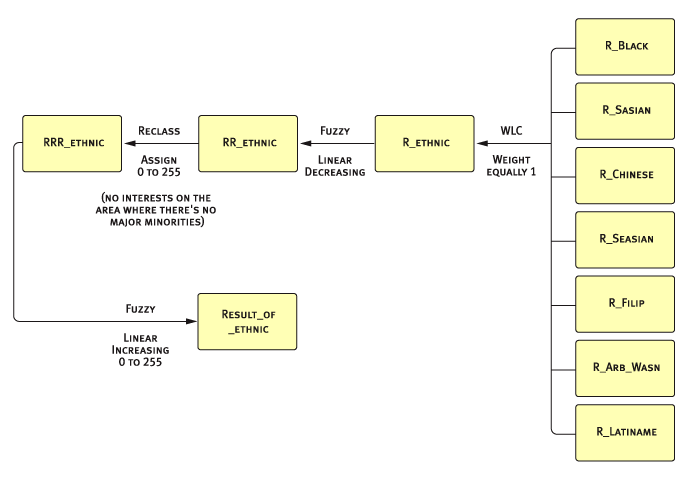
Creating a layer that shows the area where major minorities are not
clustered. |
||
 |
||
|
Creating a layer shows the area where the ratio of people who spend
more than 30% of income for their house (mortgage) and rent is high
and also the average income is low.
|
||
 |
||
|
The result of image shows the area that the ratio of people who work
full year full time and part year or part time is low. |
||
 |
||
|
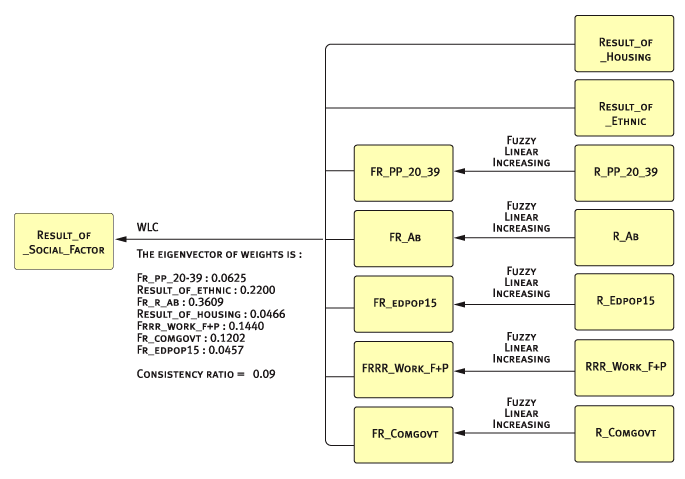
Creating a result of 7 socio-economic factors by WLC. From the background
research the relationship between the income and the ratio of suicide
is not straightforward, so I weighted less on the income related factors. |
||
 |
||
|
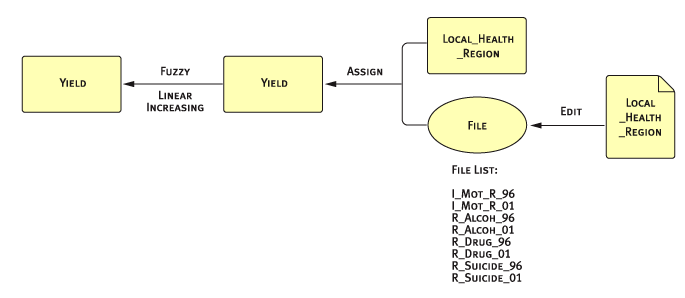
Converting a vector image to a raster image |
||
 |
||
|
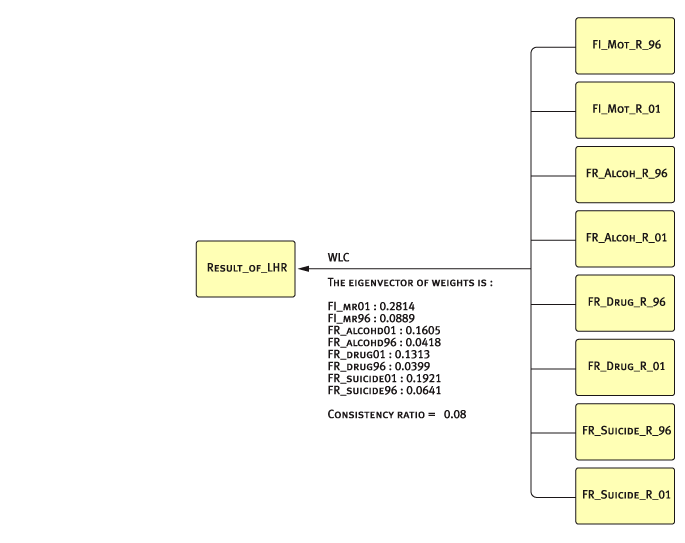
Creating 8 layers of the health related factors. |
||
 |
||
|
Creating a result of the health related factors by WLC. I weighted
less on the data 1996 than 2001 since they are old data. |
||
 |
||
|
Creating the final result of my project with the result of part A and
B. |
||
BACK --------- HOME --------- NEXT
| |
||||||
| |
|
|||||
|
|
|
|
||||
| |
|
|||||
| |
|
|
|
|
||
| |
|
|||||