
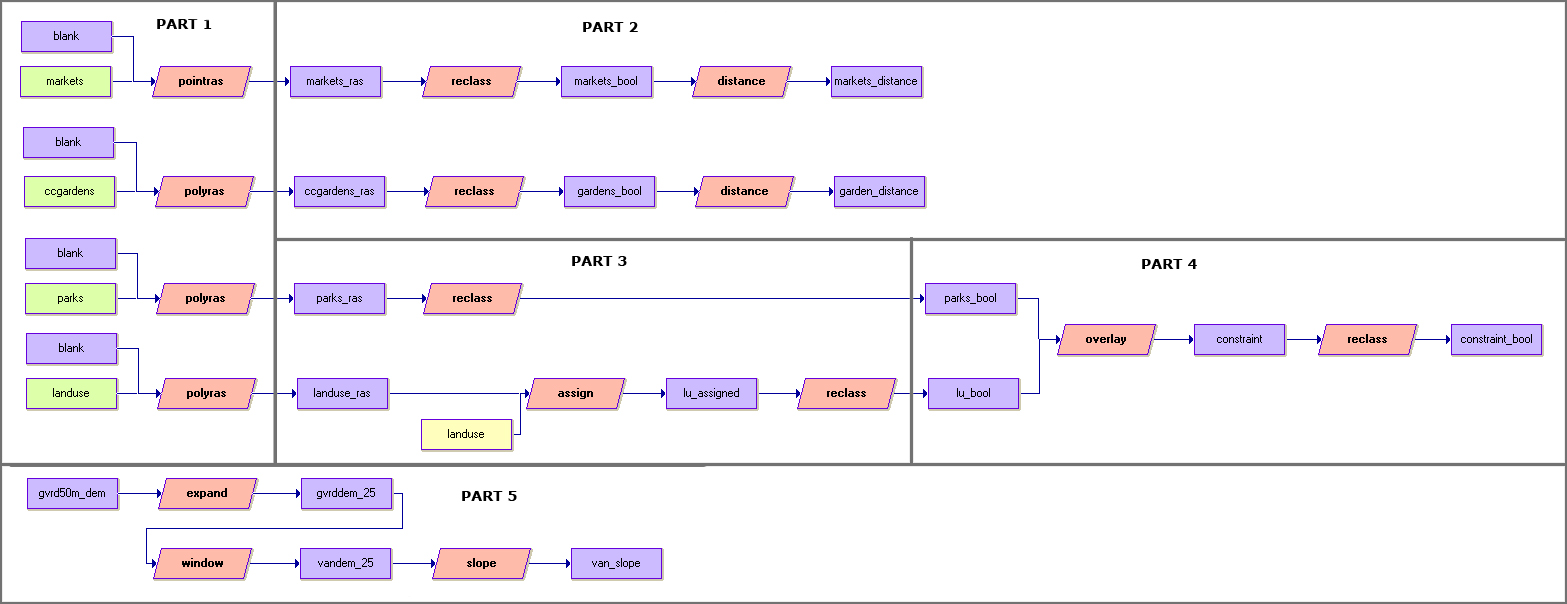
In this section I will discuss my cartographic model. It can be reviewed as a whole or in parts with the output images below.
Click here to review the entire Cartographic Model
Part 1: Rasterization and Standardization
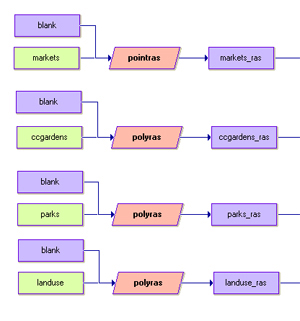
Here I am rasterizing the vector files. I created the file "blank" with the module initial where I defined the parameters for the area of coverage to be the Vancouver region and the pixel resolution to be 25m. All the outputs then would be the same size and in the same resolution.
Part 2: Market and Garden Factors
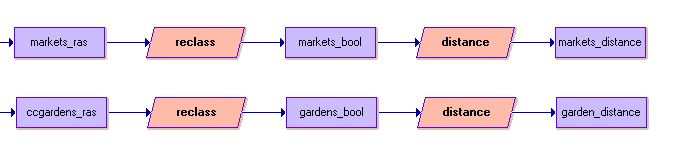
I took the market and garden data and reclassed them to boolean files. I applied the distance modules so that distance values increase as pixels get further away from the features.
market_distance
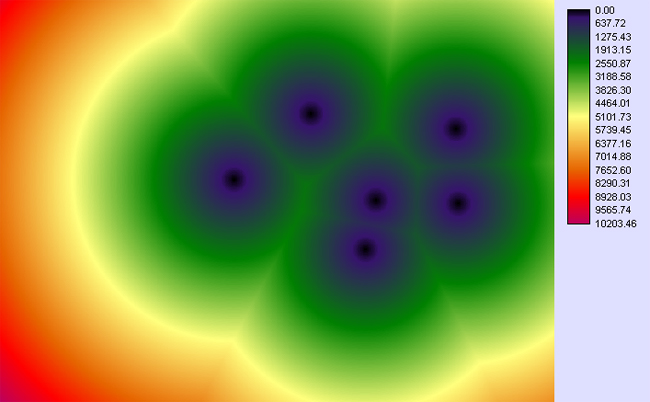
Click to enlarge
garden_distance
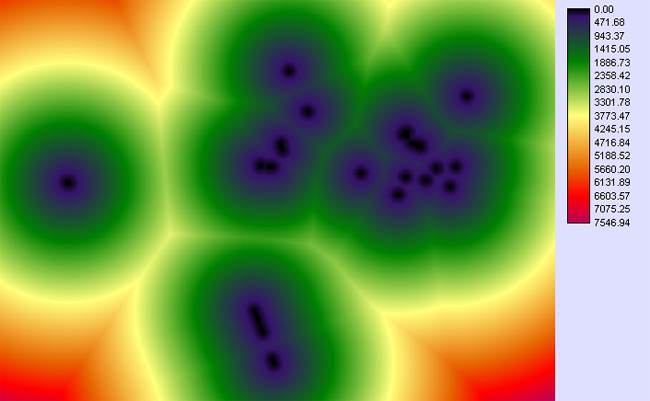
Click to enlarge
Part 3: Slope Factor
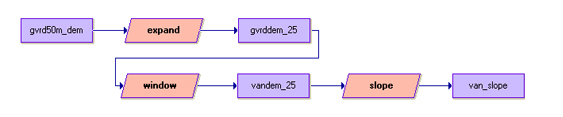
The imported dem file is in 50m resolution and needs to be in the same resolution as the other files for analysis. I expanded the image by a factor of 2 to get the resolution to be 25m--the same as all the other files. The area of coverage is of the whole GVRD and so I windowed it by the file "blank" to get a dem of just Vancouver. Then I applied the slope module and produced:
Part 4: Contraint
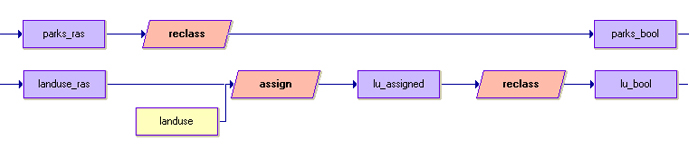
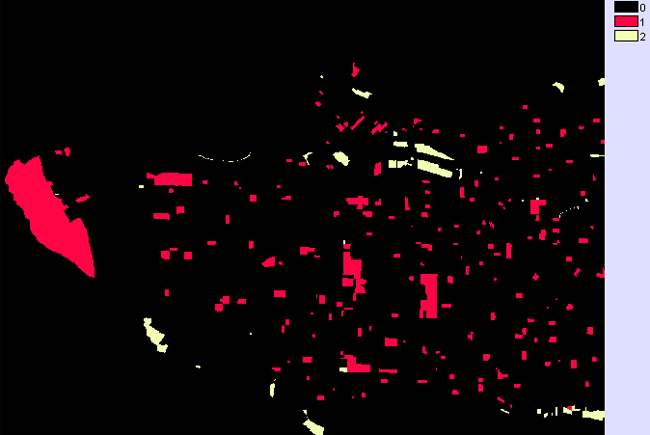
I reclassed the parks raster to get a boolean image:
parks_bool
Click to enlarge
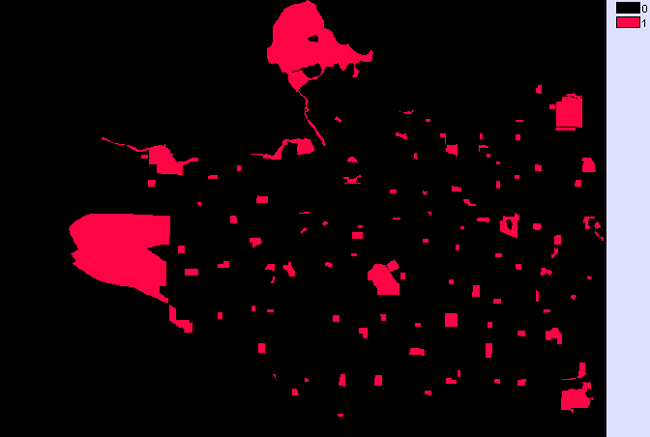
Then I overlayed the two booleans and reclassed it to get my constraint boolean.
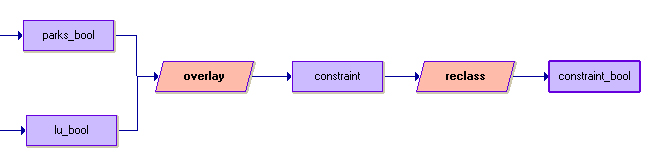
contraint_bool
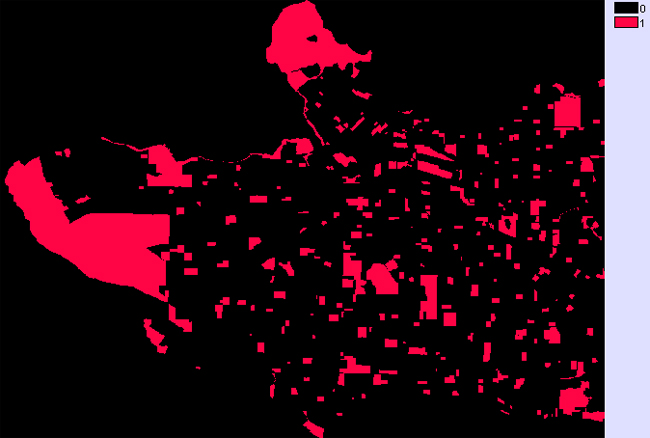
Click to enlarge
Part 5: Census Tract Data Outside Cartographic Model
Using the Database Workshop I opened the Census Tract vector link file, which was produced during the import from shape file to IDRISI, and created raster images of the income attribute and population density attribute.
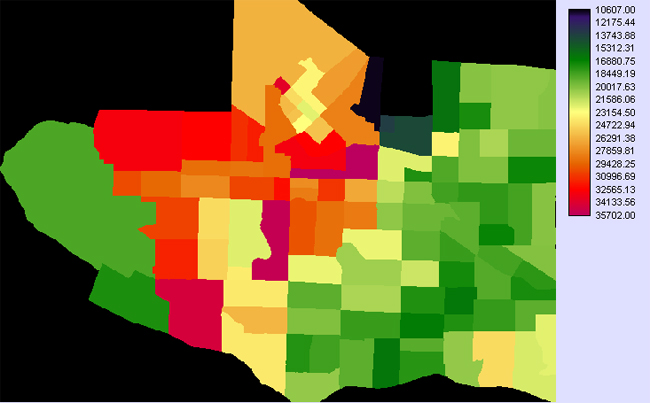
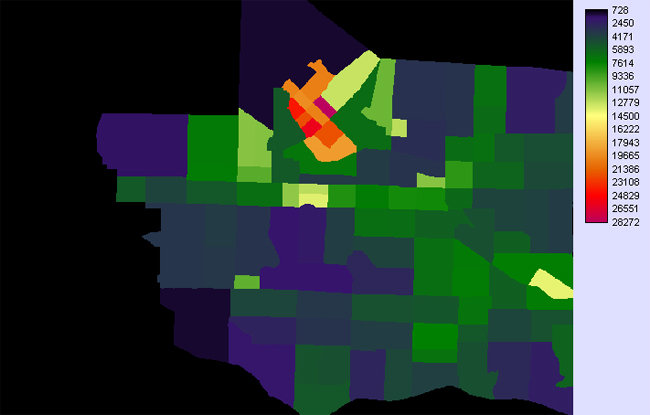
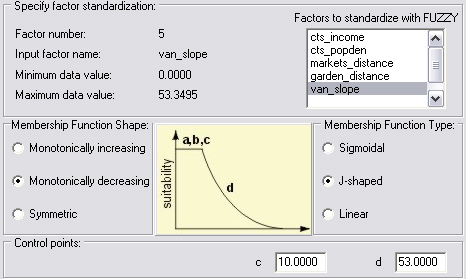
Then I input these outputs into the DecisionWizard to run a Multicriteria Analysis.