
In the DecisionWizard I specified the following
| Constraints | File | Image |
| Parks, Institutional and Open & Developed areas | constraint_bool | 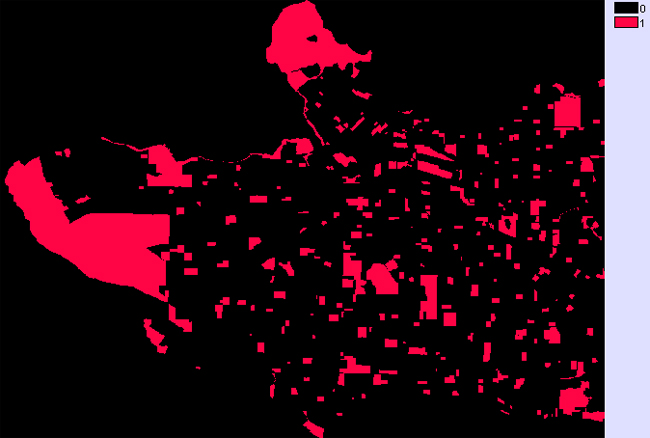 |
| Factors | File | Standardization | Fuzzy Image |
| Moderate Income | cts_income | 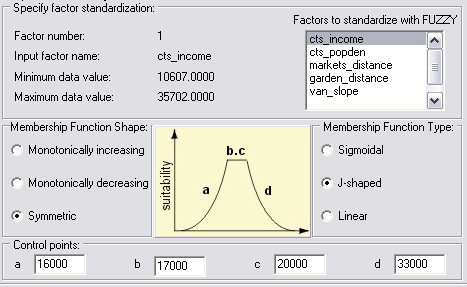 |
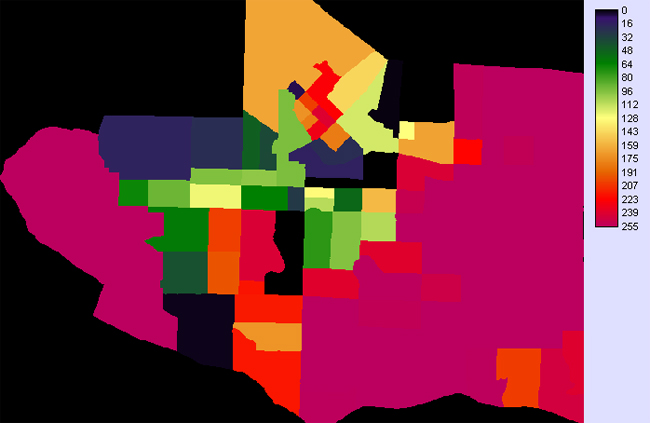 |
| High Population Density | cts_popden | 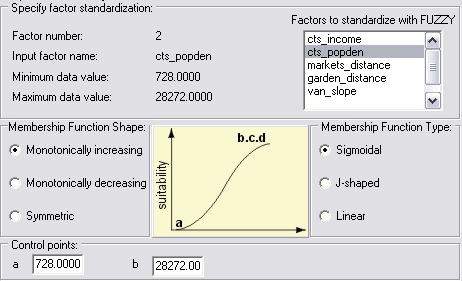 |
 |
| Proximity to Farmer's Markets | market_distance | 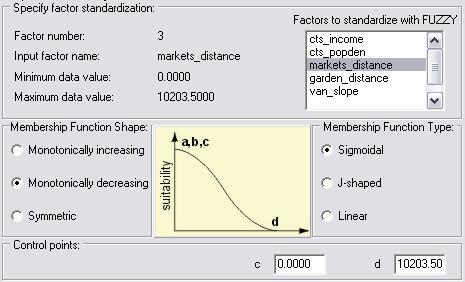 |
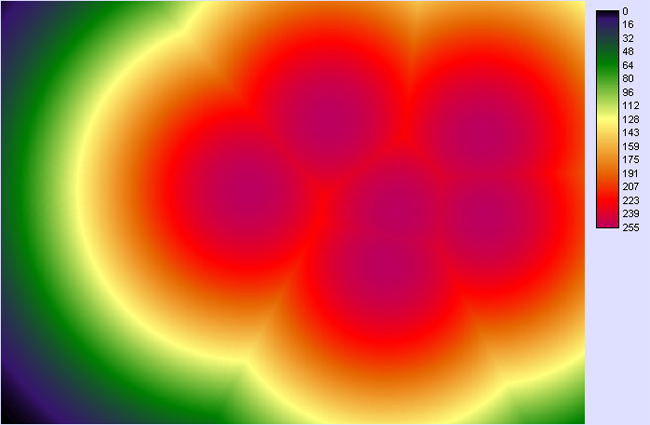 |
| Distance away from Existing Community Gardens | garden_distance |  |
 |
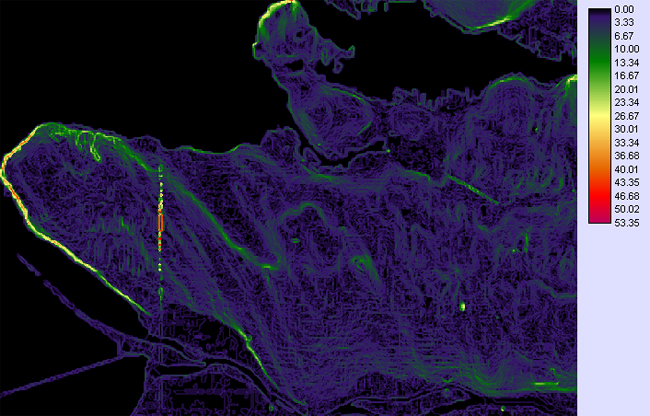
| Low Slopes | van_slope | 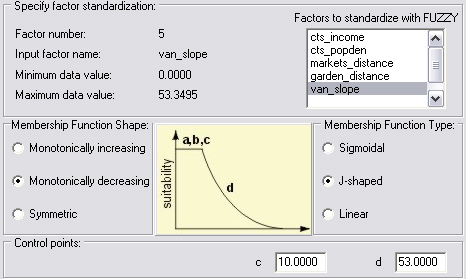 |
 |
I standardized all the factors and made them fuzzy. Then I defined the weights as follows totalling to 1:
| Factor name | Factor Weight | Rationale |
| popden_fuzz | 0.30 | Areas with high population density means people likely live on smaller properties or apartments. Since they'll likely have little or no land to garden I gave this the most weight. |
| market_fuzz | 0.25 | Proximity to markets would encourage community farming and so plots near farmer's markets will more highly likely fill up. |
| gardens_fuzz | 0.10 | A low weight, but existent so that it encourages distribution because if community farms develop, conversely new farmer's markets may be encouraged. |
| slope_fuzz | 0.10 | Low slopes are most favourable, but it has a low weight because if there's no interest to farm in the area, the low slope plot has no purpose. An area with higher slope could possibly be landscaped way to accomondate a community farm (i.e. terrace) |
| income_fuzz | 0.25 | Refer below. |
Income Rationale
I did a quick analysis in ArcMap on the existing community gardens to see what the trend in income is. I made a 1km buffer around the existing community gardens and intersected it with Census Tract shapefile:
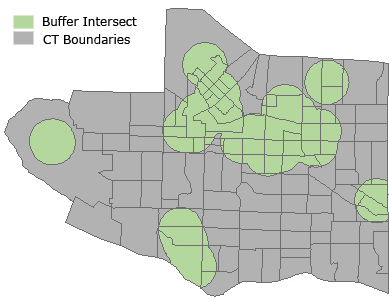
Then I opened the attributes table and viewed the statistics of the income attribute. From the Frequency Distribution I can see that the trend is moderate income: approximately above $16,000 and below $33,000. That just removes the really high and low incomes areas.
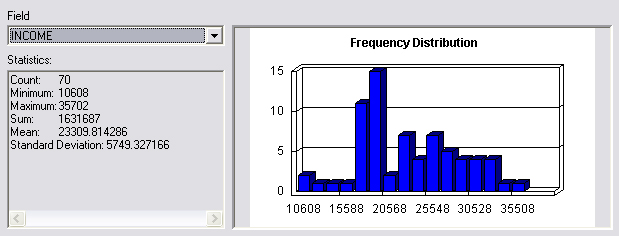
When I specified the factor standardization I thusly used the symmetric J-shaped fuction to immitate the frequency distribution
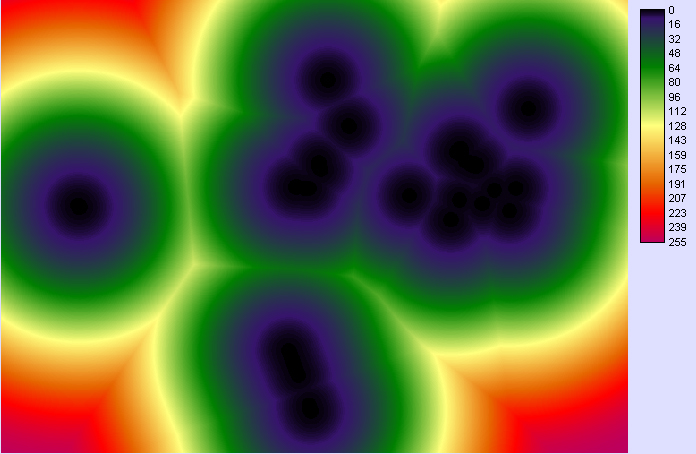
In the next section I will present my results from the MCE Analysis with OWA and without OWA.