Here a summary of all the data I used.
- Parks
- Landuse
- Digital Elevation Model (DEM)
- Existing Farmer's Markets
- Existing Community Gardens
- Census Tract Data
- Income
- Population Density
All Data were prepared in ArcMap as vector shape files (with the exception of the DEM file) and then imported into IDRISI using the SHAPEIDR module. Then I simply rasterized them with a blank file that has the spatial parameters of the Vancouver region. I set all the pixel resolutions to 25 and the reference systems to UTM-10N.
1. Vancouver Parks
Data Source: Vancouver Parks from the GVRD retrieved via SFU's DataWarehouse
File Format: Shp
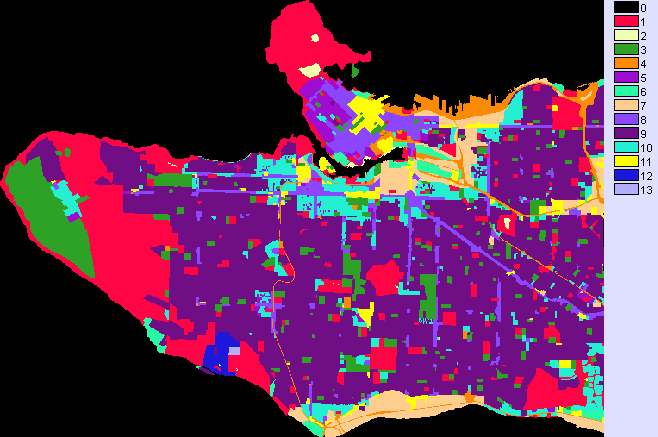
2. Vancouver Landuse
Data Source: GVRD Landuse from the GVRD retrieved via SFU's DataWarehouse
File Format: Shp
The shapefile was clipped in ArcMap with the CT boundaries shapefile as the mask.
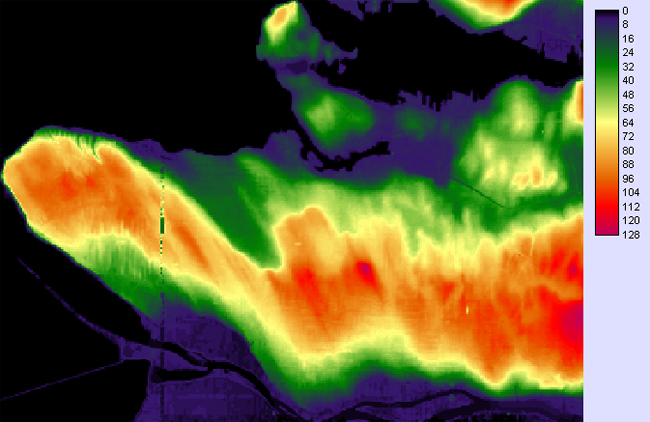
3. Vancouver DEM
Data Source: GVRD Digital Elevation Model from the GVRD retreived via SFU's DataWarehouse
File Format: Tif
The tif was imported into IDRISI as raster. I then windowed it so that the coverage area became just Vancouver.
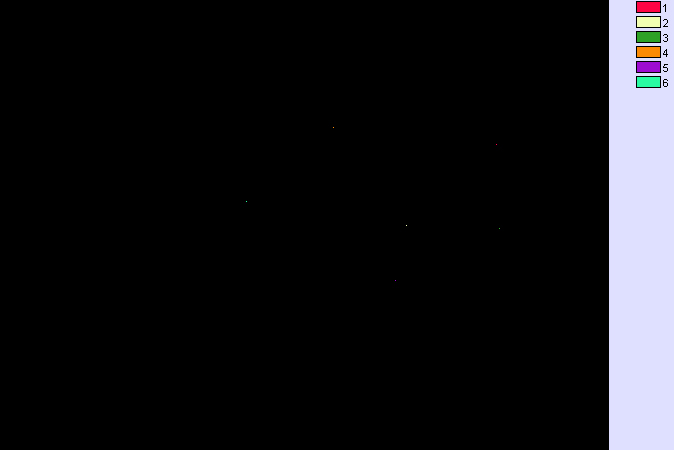
4. Existing Farmer's Markets in Vancouver
Data Source: listing from eatlocal.orgFile Format: excel table
The locational information was gathered from eatlocal.org and organized into an excel file. By entering the intersection or address of the markets in geocoder.ca, I retrieved the geographical locations in latitude and longitude.
| Market Name | Address Location | Lat | Long |
| Winter Farmers Market | WISE Hall, 1882 Adanac Street at Victoria Drive | 49.27758 | -123.06647 |
| Holiday Market | Heritage Hall, 3102 Main Street at 15th | 49.25743 | -123.10095 |
| Trout Lake Farmers Market | 15th Avenue & Victoria Drive in the Parking Lot of Trout Lake Community Centre | 49.25649 | -123.06544 |
| West End Farmers Market | 1100 Block of Comox Street across from Nelson Park at Mole Hill | 49.28189 | -123.12907 |
| Riley Park Farmers Market | 30th and Ontario Street, Parking Lot of Riley Park Community Centre | 49.24346 | -123.10542 |
| Kitsilano Farmers Market | 10th Avenue and Larch Street, Parking Lot of Kitsilano Community Centre | 49.26315 | -123.16246 |
The table is above is a reproduction of my farmer's market excel file. I had included the descriptive parts of the addresses to couple with my knowledge of Vancouver to ensure that the locations entered are the correct geographical locations. (further discussed in the problems section) I made a point shapefile with my excel table in ArcMap by using the "Add XY Data.." module under the Tools menu. I then imported the vector shapefile into IDRISI to get a vector IDRISI file and rasterized it.
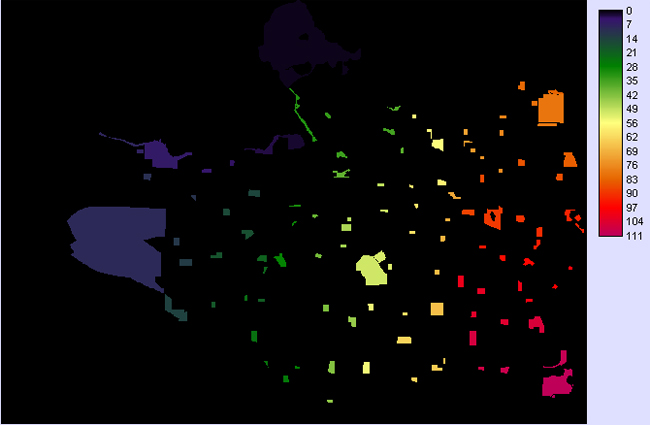
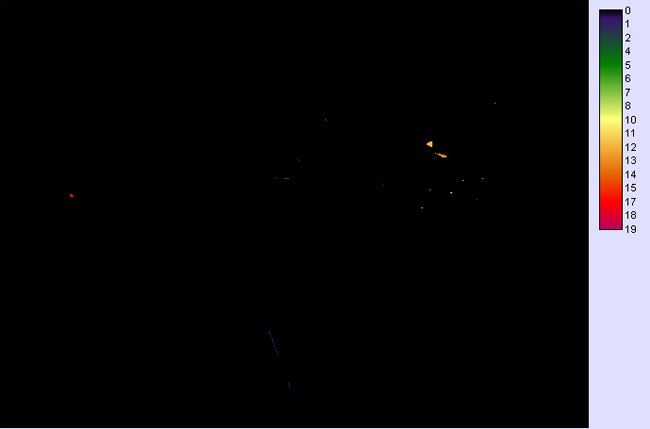
5. Existing Community Gardens in Vancouver
Data Source: listing from Vancouver Community Services Website
File Format: excel table
Click here to view my data table
The data was gathered into an excel chart and the intersections were geocoded to give a rough estimation of the garden locations. The method that was used to produce the markets data was also used here. However, Google Earth and a road network shapefile was used in conjunction to varify the locations. The longitudes and latitudes produced point locations, but (later on) I realized that garden plots are inherently areal. With the aid of Google Earth's road network and a Vancouver road network shapefile I digitized the approximate area of the garden plots through visual recognition and from ground truth. I encountered a few problems which will be discussed on the Problems page.
Raster Output in IDRISI:
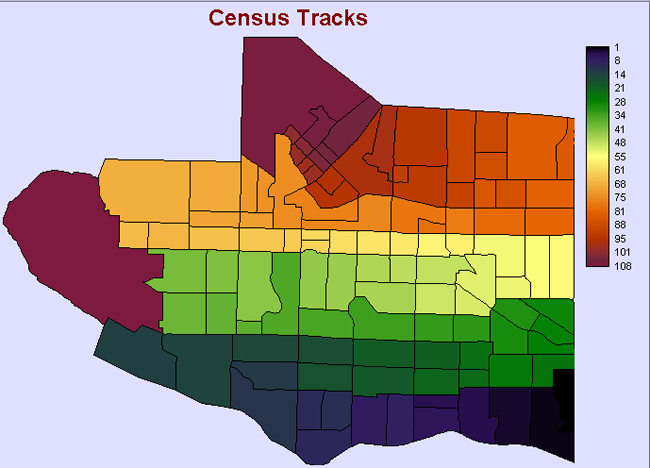
6. Census Tracts for Income and Population Density
Data Source: Census Tracts (CT) from Census Canada 2006 and SFU's DataWarehouse
Census Data File Format: table (dbf)
Boundaries File Format: Shp
I gathered Population and Income data from Census Canada 2006 CT Profiles into excel, saved it as a database file (.dbf) and joined it to the CT boundaries shape file from SFU's DataWarehouse. Then I imported it into IDRISI which produced the vector file displayed below and a vector link file containing the attributes income and population density (they will be displayed in the next section).
Vector Output in IDRISI based on the unique ID's: