Discussion and Results
Earthquakes
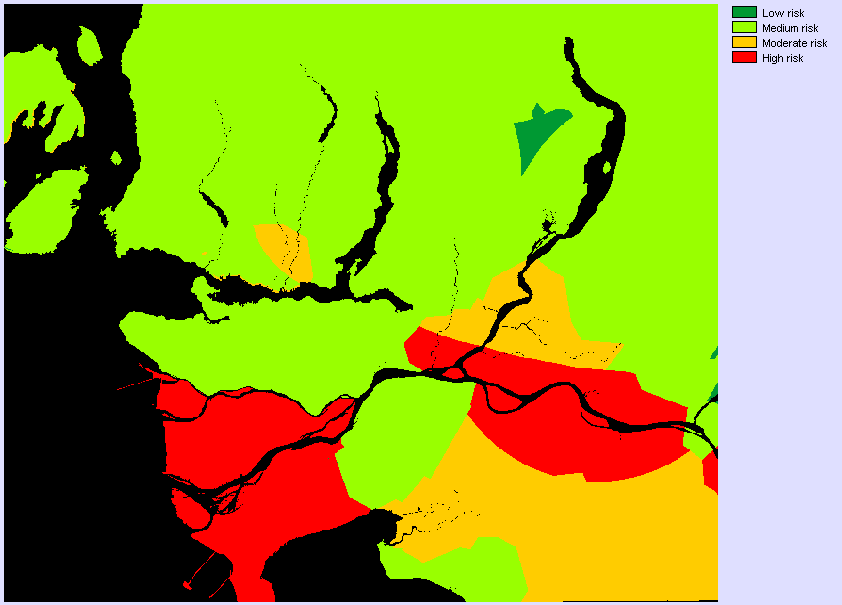
The result from MCE/WLC for earthquake risk show that areas such as Richmond, Delta, and parts of Surrey with surficial material composed mainly of alluvial deposits are most at risk of damage from earthquakes.
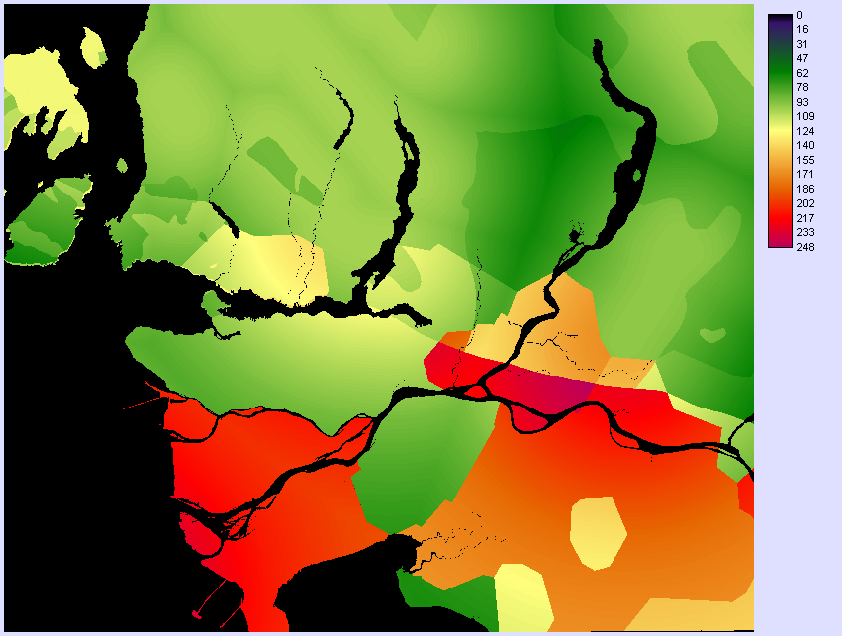
MCE/WLC analysis of earthquake risk in the GVRD
Landslides
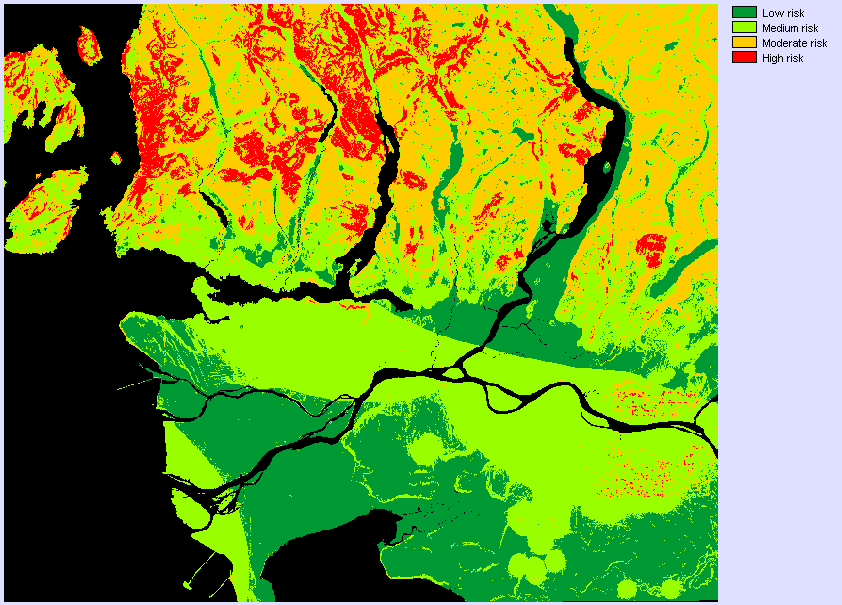
Much of the GVRD's landslide hazards are located in the mountainous areas to the north. One noteable area of interest is the north facing slope of Burnaby mountain on which SFU is located. From the analysis, it shows that the steep north side of the mountain is subject to a high landslide risk.
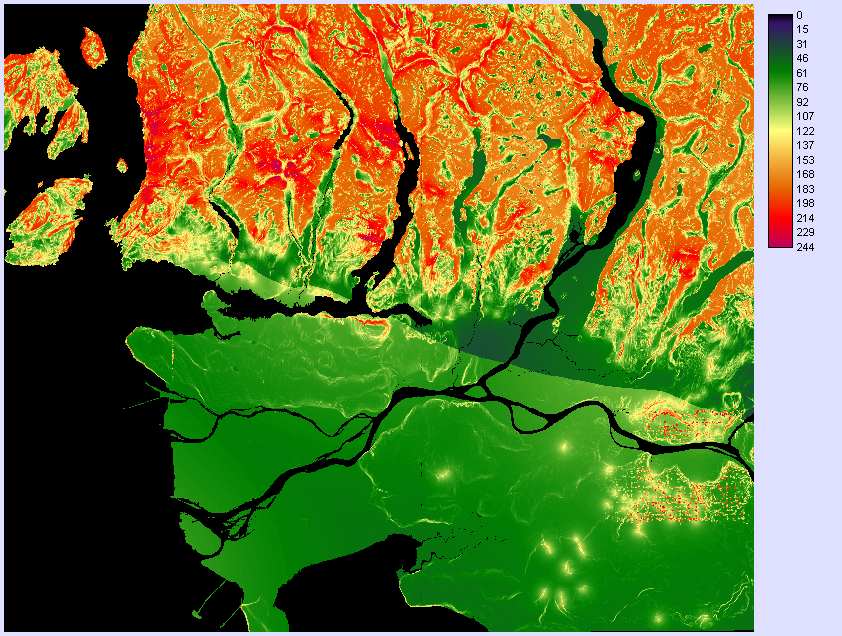
MCE/WLC analysis for landslide risk in the GVRD
Flooding
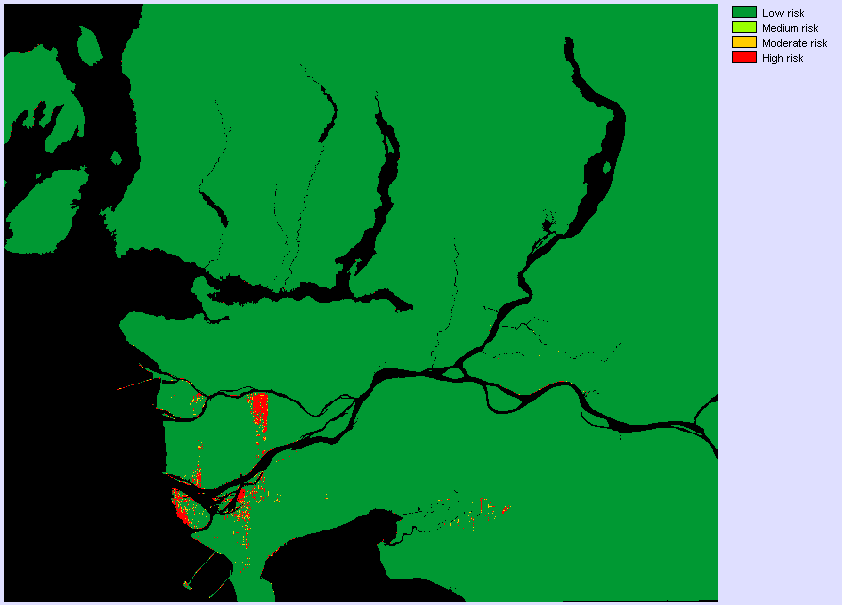
The result from FUZZY analysis for flooding risk due to rise of water level between 0m and 1m above sea level. This hazard is mainly confined to low lying areas in Richmond and Delta.
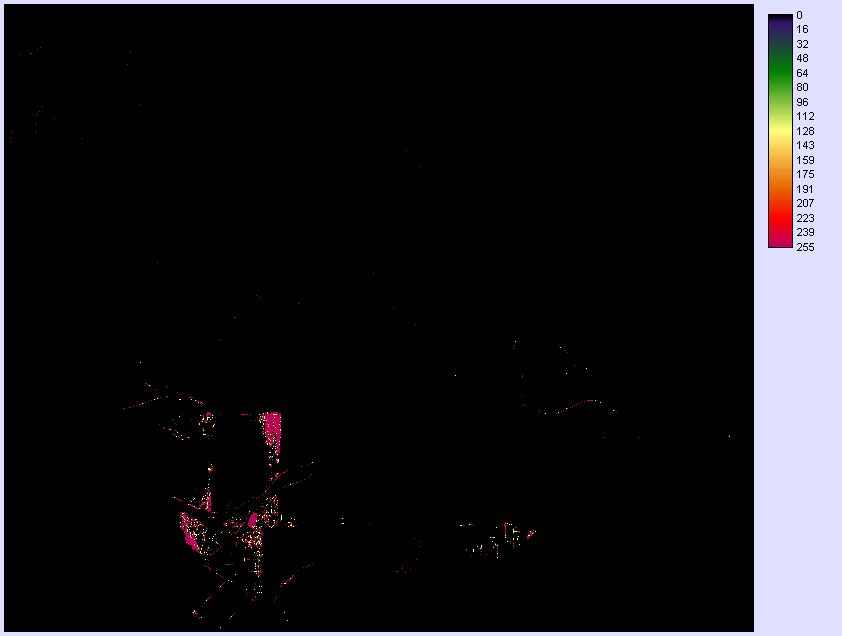
FUZZY result for flooding risk for elevations between 0-1m
Aggregate Risks From All 3 Geologic Hazards
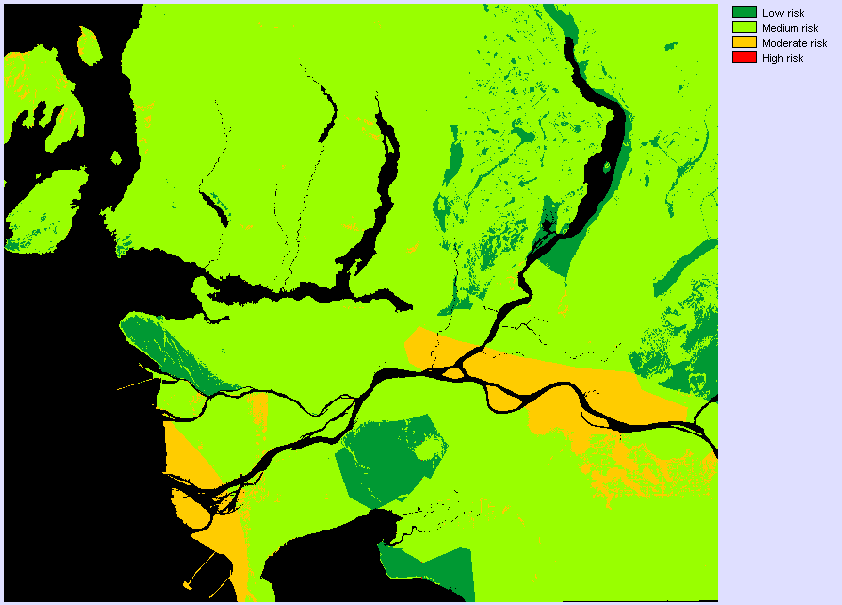
To examine the combined risks from all 3 geologic hazards, a weighted approach was used. Earthquakes were considered to be the most important hazard that would cause the most widespread damage and affect a larger proportion of the population. A weight of 0.5 was assigned to earthquake risk, while 0.25 was assigned to both landslide and flood risks.
The reasoning for this was that landslides are generally isolated events that affect only small areas, and compared to the damage and effects caused by earthquakes, is a relatively minor hazard. Flooding is also a somewhat minor risk due to the fact that many low lying areas in the GVRD such as Richmond and Delta have dikes and pumping stations which mitigate the risks of floods. No data was available for the height of dikes currently in place to prevent flooding. Only in the unlikely event of a dike failure would the areas shown to be at risk of flooding actually be affected.
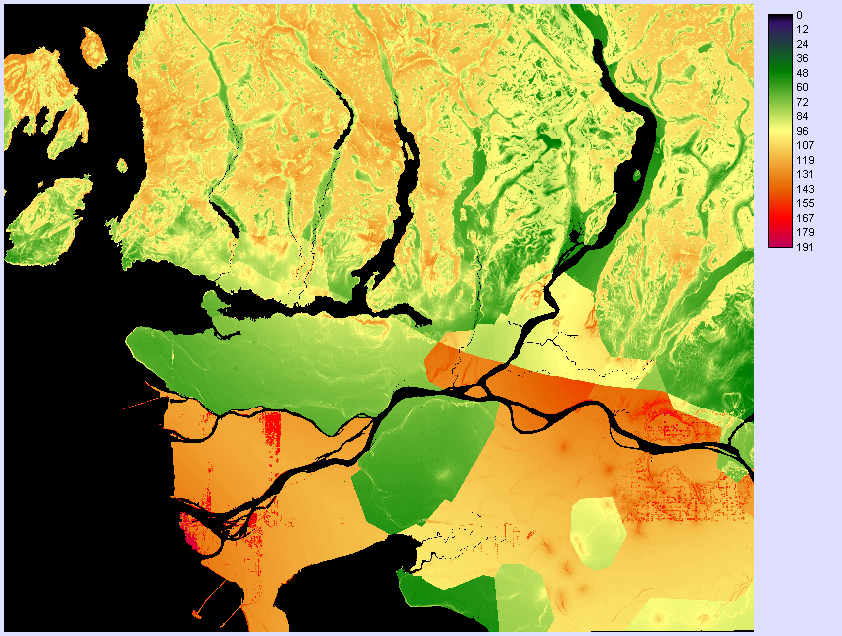
Weighted analysis for combined risks from earthquakes, landslides and flooding
Effects of Hazards on the Residents of the GVRD
To determine the number of people affected by each hazard, each hazard was reclassed into three categories: low risk, medium risk, moderate risk, and high risk. These categories were assigned as low risk: 0 - 64, medium risk: 64 - 128, moderate risk: 128 - 192, and high risk: 192 - 255.
Risk categories for earthquakes
Risk categories for landslides
Risk categories for flooding
Risk categories for all 3 hazards
The EXTRACT operation with tabular output format was then used with the cell population density raster to extract the total population of people residing in high risk areas for each hazard. These figures are based on information reported by the 2006 census. For reference, the total population for the area was 2,108,777 at the time of the census.
For the earthquke hazard, approximately 363,136 people live in the high risk zone.
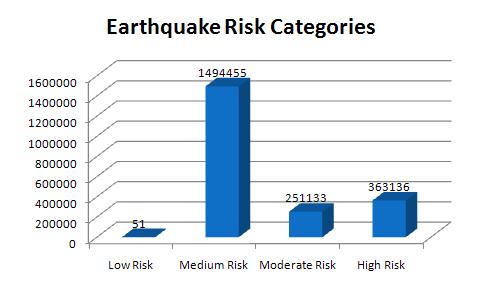
Population categorized by risk from earthquakes
For the landslide hazard, approximately 2,130 people live in the high risk zone.
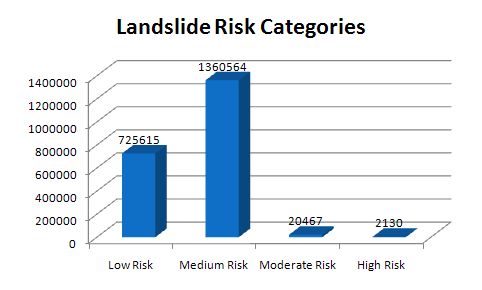
Population categorized by risk from landslides
For the flood hazard, approximately 5,564 people live in the high risk zone.
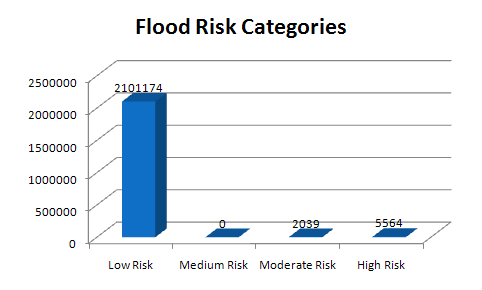
Population categorized by risk from flooding
For overall risk from all 3 hazards, using the same criteria to determine categories, there was no high risk category. However, approximately 201,290 people reside in the moderate risk zone.
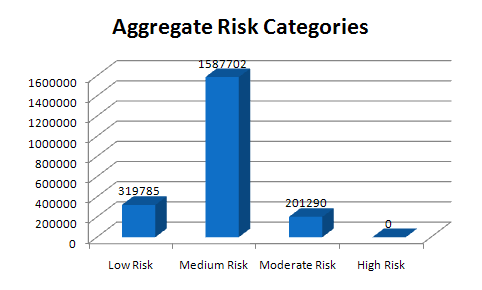
Population categorized by risk from all 3 hazards - earthquakes, landslides and flooding
The best way to lower exposure to these hazards would be to have less people residing in zones of high risk. However, as the population for our cities continue to grow, and a finite amount of space to expand into, it it inevitable for more people to move into zones of higher risk. Although it seems to be an undesireable prospect to reside in these zones of higher risk, proper planning and construction techniques can mitigate a large amount of risk associated with living in these areas.