| Constraints |
Factors |
|
|
My constraint files were indusbool and transbool and the factor files were comm-dist, parks-dist, undevel-dist, water-dist, and schools-dist. Using the FUZZY Factor Standardization method, I established the Function Type, Function Shape, and Control Points for each of the five factors. The table below lists values used:
| Commercial |
Parks |
Undeveloped |
Water |
Schools |
|
| Function
Type |
J-shape |
J-shape |
Linear |
Sigmoidal |
J-shape |
| Function
Shape |
monotonically decreasing |
symmetric |
monotonically decreasing |
monotonically decreasing |
symmetric |
| Control
Points - a |
- |
0 |
- |
- |
0 |
| b |
- |
50 |
- |
- |
300 |
| c |
1000 |
750 |
0 |
0 |
1500 |
| d |
6000 |
1500 |
1200 |
1500 |
5000 |
These values, however, did not produce good results due to large distance values. I changed the values for the "d" Control Points for Commercial, Undeveloped, Water, and Schools to end up with the following table:
| Commercial |
Parks |
Undeveloped |
Water |
Schools |
|
| Function
Type |
J-shape |
J-shape |
Linear |
Sigmoidal |
J-shape |
| Function
Shape |
monotonically decreasing |
symmetric |
monotonically decreasing |
monotonically decreasing |
symmetric |
| Control
Points - a |
- |
0 |
- |
- |
0 |
| b |
- |
50 |
- |
- |
300 |
| c |
1000 |
750 |
0 |
0 |
1500 |
| d |
3000 |
1500 |
1000 |
1000 |
3000 |
This produced better results. The images produced were called commfuzz, parksfuzz, undevelfuzz, waterfuzz, and parksfuzz. The next step in the Decision Wizard involved choosing a Factor Weighting Option. Using the Analytical Hierarchy Process (AHP) option. This created the following pairwise comparison file from the follwing matrix:
| commfuzz |
parksfuzz |
undevelfuzz |
waterfuzz |
schoolsfuzz |
|
| commfuzz |
1 |
||||
| parksfuzz |
5 |
1 |
|||
| undevelfuzz |
5 |
1/5 |
1 |
||
| waterfuzz |
1 |
1/5 |
1/5 |
1 |
|
| schoolsfuzz |
3 |
1/3 |
1/3 |
1 |
1 |
The resulting eigenvector of weights (left) and decision support file (right) were:
 |
 |
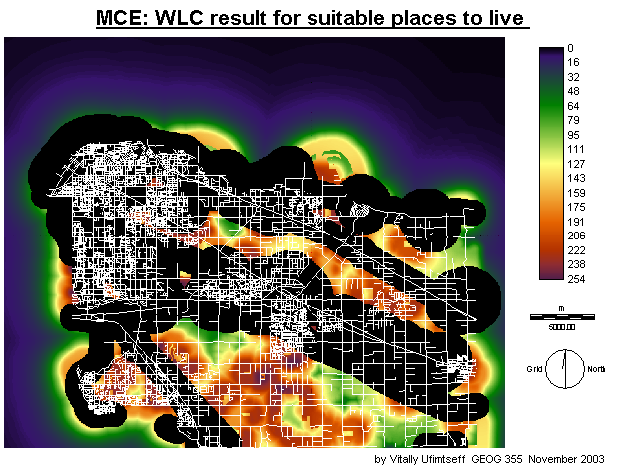
From the eigenvectors of weights, the consistency ratio was acceptable allowing me to proceed and aggregate the data by Weighted Linear Combination (WLC). This enables the factors to be multiplied by their corresponding weights. The resulting image is an MCE WLC image called MCEWLCsuitable shown below:
In order to
find the suitable places to live, I used the RECLASS module to classify
unsuitable areas as values ranging
from 0
to 175 and suitable areas as 175 to 255.
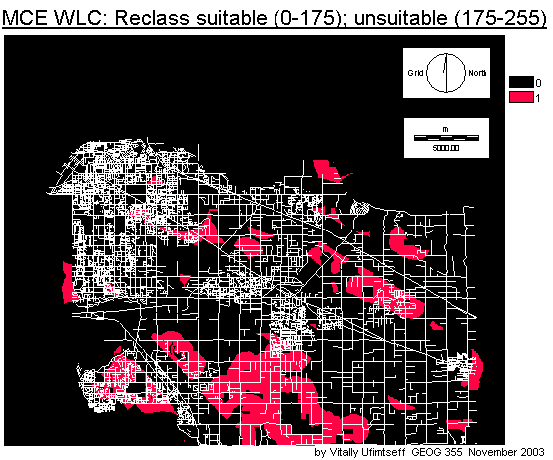
This produced too many areas. I finally ended up with a suitable image reclassed to portray unsuitable as 0 to 225 and suitable areas as 225 to 255. Here is the macro model I used:
This produced too many areas. I finally ended up with a suitable image reclassed to portray unsuitable as 0 to 225 and suitable areas as 225 to 255. Here is the macro model I used:
The resulting final image using MCE and WLC is:


 Vitally
Ufimtseff
Vitally
UfimtseffGEOG 355 Term Project
November 2003