Spatial Analysis

Home
Study Design and Hypothesis
Research Background
Data Sources
Methodology
Spatial Analysis
Conclusion
Problems and Discussion

1. Surface Modeling and Analysis
    
        Interpreting point data into a full surface can be carried out either by a distance-weighted average or by a potential model such as kriging. With both models, the exponent associated with the distance weight is user-defined. The points used in this project were in regular grid format, 1000*1000 meters. The IDW predicated  elevation has less square of error than these predicated by kringing.  These assessment was done by randomly comparing the twenty predicated elevation points between IDW and kringing methods.
         For getting more accurate DEM surface using IDW method, a group of  comparison was carried out and the mean error was used to assess the DEM quality and accuracy. In this comparison, the power as two and neighbor cell number as eight were the best setting of IDW to generate the DEM surface.
  Table 1 Comparison of mean Errors of  IDW methods
Power of IDW
2
3
4
Neighbor Cell Number 8
0.64
1.86
2.65
Neighbor Cell Number 16
1.32
2.49
3.17
Neighbor Cell Number 24
1.20
2.43
3.16

2. Generating Factor Surfaces
   
           The temperature and soil moisture surfaces demonstrate the spatial patterns of these two factors.  The correlation coefficient between temperature and elevation is calculated and equal to -0.768, and the correlation coefficient between soil moisture and elevation is equal to -0.715. Overall, the predicated temperature surface has demonstrated a good relation with the elevation.  The soil moisture  shows good relation until some bias data were taken away.
           The slope surface was created in a very simple way by using Surface/Slope analysis tool in IDRISI. And cost surface was based on the distance from the Haibei research station  and friction values depending on the landuse types.
                 

3. Suitability  Analysis
           
            Suitability analysis was carried out using IDRISI Decision Wizard. Click on Slides Show will demonstrate the process.
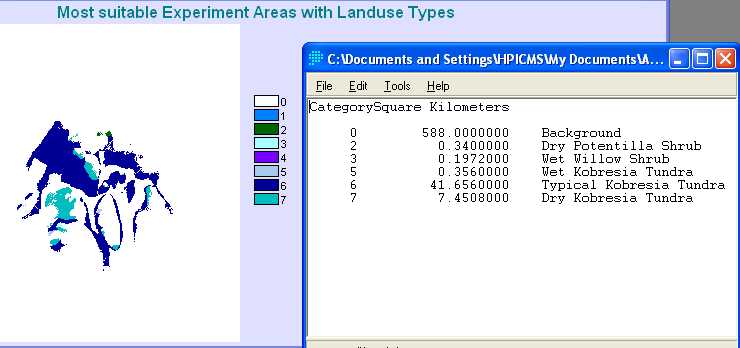
          The cell size in the raster images is 20 meters. When the total numbers of cells are 50,000, 125,000 and 250,000, the best suitable experiment areas are counted and displayed as final results. The one of example, the following picture shows the different land use class percentage on best suitable experiment areas.

BestArealandcls


PreviousPrevious                     Home                                    NextNext