Conclusion

Home
Study Design and Hypothesis
Research Background
Data Sources
Methodology
Spatial Analysis
Conclusion
Problems and Discussion

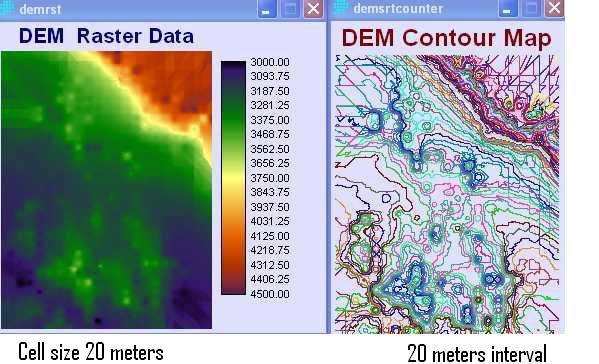
1. Digital Elevation Model ( DEM) 

        
DEM is a digital file consisting of the elevation data for the  ground positions. A great effect was put on generating DEM. The comparison between IDW and Kringing, and different power settings and neighbor cell Numbers in IDW analysis provide more accuracy on the final DEM data. 

DEMContour


2. Factor Surfaces

         
The
DEM data was used to generate the temperature, soil moisture, slope surfaces and cost surface. Once the DEM was imported into Idrisi and set up correct numbers of rows and column and projection for DEM data, these processes were in right tracks.


3. Suitability Assessments

         Understanding the effects of the environment factors on ecosystem is very important in picking the curves and setting the suitability values and ranges. For example, the temperature surface shows the minimum as 0.91 and maximum as 14.90, which are used as minimum and maximum for suitability.  The suitability values is defined as linear increasing, which means the area with higher temperature is better for conducting global warming research.
           The soil moisture varied in the medial range was the best suitability for detecting the ecosystem response to global changes. The too dry or too wet areas (close to water) was considered as lower suitability.  
          The cost surface is described as the closer the better, until reaching 1000 cost values, and over 3000 of cost surface values would be considered very hard to conduct the experiment.

3.Weighting Factors for Aggregation

              The logic of achieving objective was carried on weighting factors for aggregation. The temperature is a dominated factors over all other factors. The soil moisture is important but less than temperature. The cost surfaces is more important than landfuzz and slope. These make the consistence value is lower and acceptable as 0.04.  The factor weights are calculated and presented with quantitative values.      


 4.  Benefits From This Project

               The WCE_WLC is very comprehensive method to combine multiple criteria to analyze the spatial relation on the defined subject. The final most suitable areas for global warming experiment are very productive and useful result. The most suitable experiment maps with 20 km2 , 50 km2 and 100 km2  provide more choices to select different landuse types for the field experiments in the different scale. These most suitable experiment areas are generated in same criteria and conditions and method, it implys that spatial analysis can be successfully mimicking in a GIS environment .


PreviousPrevious                   Home                                      NextNext