Click here to see the cartographic
model of this project
.
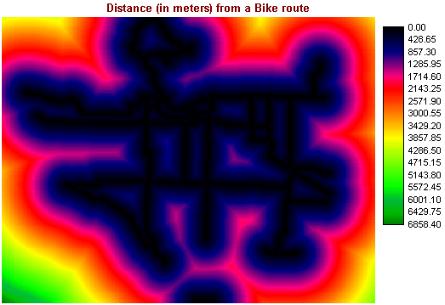
The first step in analyzing this problem it to calculate the distance from each pixel to each of the 9 criteria for evaluation. To calculate this, the DISTANCE function was run on each layer. Here is a sample of the results:
Distance from Bike routes: Distance from a firehall:
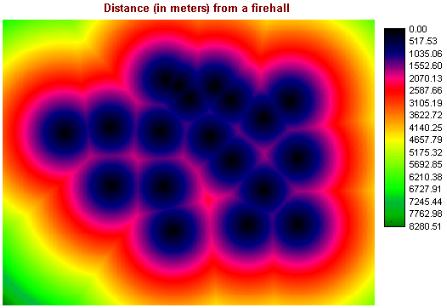
Distance from Shopping area:
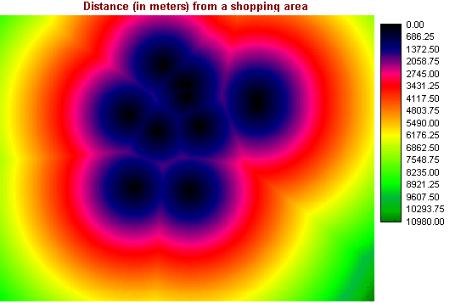
For the first kind of MCE, I decided to find all of the areas that contained at least 5 of the 9 criteria. To do this, I converted each distance coverage to a boolean image, based on my (somewhat arbitrary) conditions, and then added the images together using the OVERLAY function. The conditions that I used are as follows:
Suitable distance from water: Suitable distance from a bus route:
Suitable distance from a side road:
I then used the following macro to perfrom the OVERLAY addition to add the layers together:
Original overlay:
Reclassed Overlay to show most suitable areas:
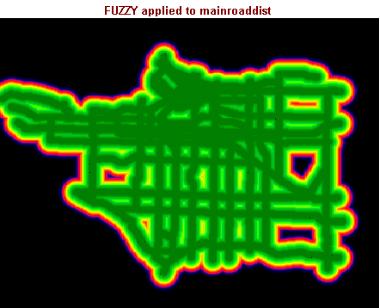
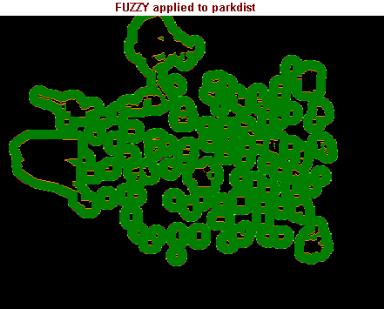
For the next type of MCE I performed, I needed to reclassify the distance images using the FUZZY command. The specific functions that I used are outlined below. The main difference between J shaped functions and Sigmoidal functions is that Sigmoidal functions reach 0 at one of the control points, while J-shaped functions are asymtotic to 0 (they never actually reach 0), and the control points represent the point where suitability is 0.5 on a 0 - 1 scale.
FUZZY applied to the Main road distance coverage: FUZZY applied to the park distance coverage:
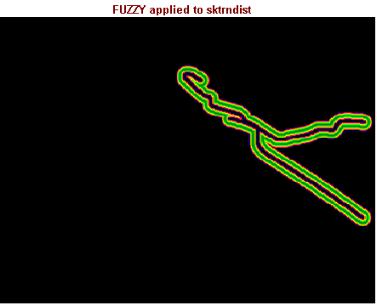
FUZZY applied to the Skytrain distance coverage:
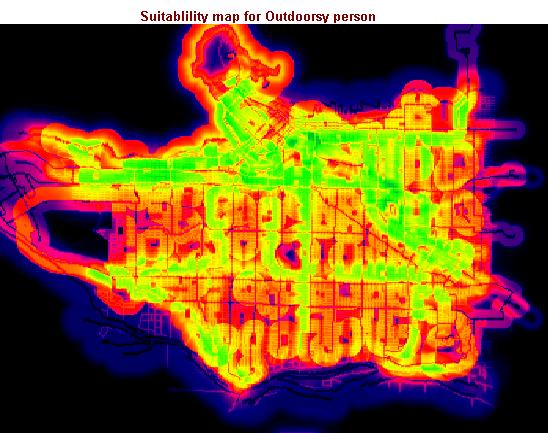
After all of the FUZZY images were created, used the WEIGHT function to determine the wieghts on the various criteria. I generated 2 different weight files, based on 2 different types of theoretical people, who are looking to move into the city. The first person is an outdoorsy-type, and had preferences as follows:
For the second evaluation, I adjusted the weights to more suit the following hypothetical person:
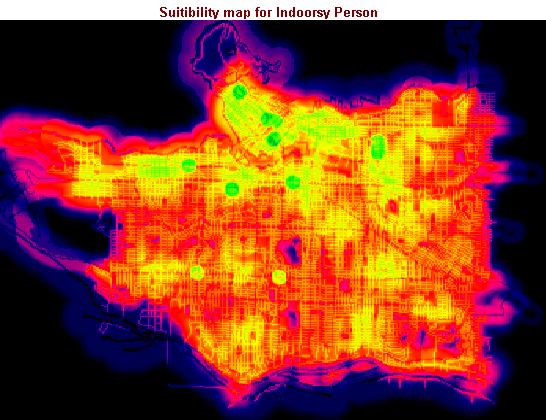
My final step was to RECLASS both of these images to identify spots where the suitibility was above a certain value. I choose 175 out of 256 as this value and reclassified the images as such. Here are the results:
RECLASS of the Outdoor person's map: RECLASS of the Indoor person's map:
The first step in analyzing this problem it to calculate the distance from each pixel to each of the 9 criteria for evaluation. To calculate this, the DISTANCE function was run on each layer. Here is a sample of the results:
Distance from Bike routes: Distance from a firehall:
Distance from Shopping area:
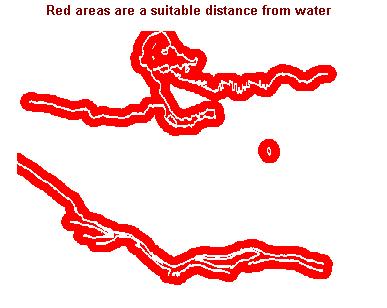
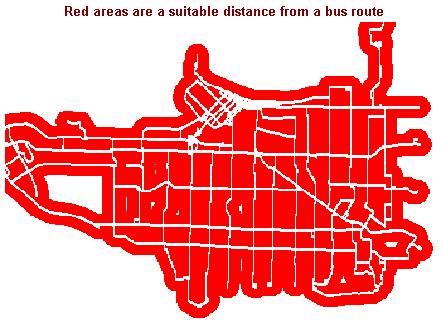
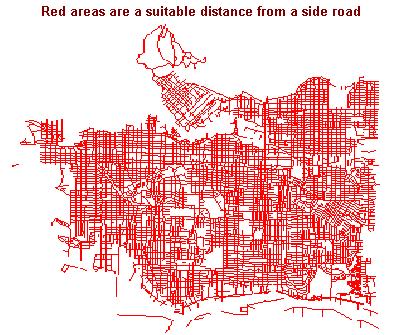
For the first kind of MCE, I decided to find all of the areas that contained at least 5 of the 9 criteria. To do this, I converted each distance coverage to a boolean image, based on my (somewhat arbitrary) conditions, and then added the images together using the OVERLAY function. The conditions that I used are as follows:
- The site must be between 100 and 1000 meters from a main road
- The site must be less than 20m from a side road
- The site must be within 100m of a bike route
- The site must be between 100 and 500 meters from the Skytrain route
- The site must 50 and 700 meters from a park
- The site must be within 200 meters of a shopping district
- The site must be between 50 and 1500m from a fire department
- The site must be between 50 and 500 meters from a bus route
- The site must be between 50 and 500m from the water
Suitable distance from water: Suitable distance from a bus route:
Suitable distance from a side road:
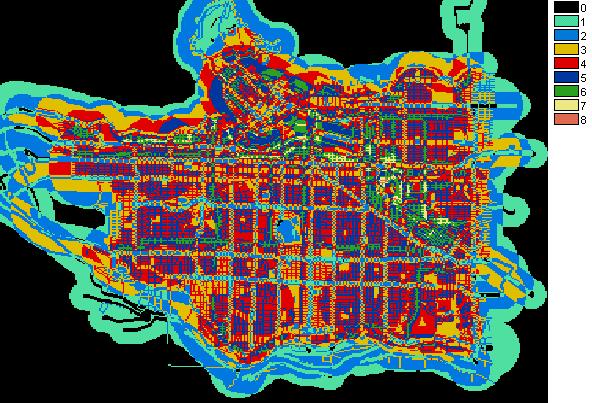
I then used the following macro to perfrom the OVERLAY addition to add the layers together:
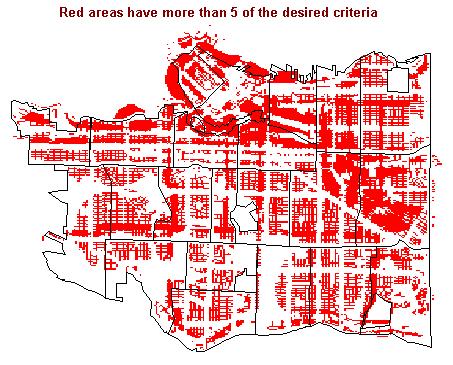
overlay x 1*mainroadbool*sideroadbool*temp1The result of the operation is below. I then did another RECLASS operation to reassign a new value of 1 to all squares where the boolean add resulted in a value of 5 or more.
overlay x 1*temp1*bikebool*temp2
overlay x 1*temp2*skytrnbool*temp3
overlay x 1*temp3*parkbool*temp4
overlay x 1*temp4*shopbool*temp5
overlay x 1*temp5*firebool*temp6
overlay x 1*temp6*busbool*temp7
overlay x 1*temp7*waterbool*overlay-final
Original overlay:
Reclassed Overlay to show most suitable areas:
For the next type of MCE I performed, I needed to reclassify the distance images using the FUZZY command. The specific functions that I used are outlined below. The main difference between J shaped functions and Sigmoidal functions is that Sigmoidal functions reach 0 at one of the control points, while J-shaped functions are asymtotic to 0 (they never actually reach 0), and the control points represent the point where suitability is 0.5 on a 0 - 1 scale.
- Mainfuzz - decreasing Sigmoidal - control points (c, d) at 100m, 1000m
- Sidefuzz - decreasing J-shaped - control points at 20m, 40m
- Bikefuzz - decreasing J-shaped - control points at 100m, 300m
- Skytrnfuzz - Symmetric Sigmoidal - control points at 0m ,250m, 250m, 500m
- parkfuzz - Symmetric J-shaped - control points at 35m, 50m, 500m, 550m
- shopfuzz - J-Shaped - control points at 200m, 300m
- firefuzz - decreasing Sigmoidal - control points at 50m, 1500m
- busfuzz - J-shaped - control points at 35m, 50m, 300m, 350m
- waterfuzz - Symmetric Sigmoidal - control points at 35m, 50m, 500m, 1000m
FUZZY applied to the Main road distance coverage: FUZZY applied to the park distance coverage:
FUZZY applied to the Skytrain distance coverage:
After all of the FUZZY images were created, used the WEIGHT function to determine the wieghts on the various criteria. I generated 2 different weight files, based on 2 different types of theoretical people, who are looking to move into the city. The first person is an outdoorsy-type, and had preferences as follows:
- Must live near a bike route, since she commutes by bike to work
- Likes to walk in the park, so distance to that is also important
- Doesn't own a car, so close to transit is also important
- Would prefer to live away from a main road and shopping areas, to cut down on noise/crowds/pollution
- Wants to be a reasonable distance from a firehall, for safety's sake
The eigenvector of weights is :Running MCE with these weights produces the following output file, which I think is neat-looking:
mainfuzz : 0.0471
sidefuzz : 0.0695
bikefuzz : 0.2393
skytrnfuzz : 0.0965
parkfuzz : 0.1624
shopfuzz : 0.0436
firefuzz : 0.0962
busfuzz : 0.1505
waterfuzz : 0.0949
Consistency ratio = 0.09
Consistency is acceptable.
For the second evaluation, I adjusted the weights to more suit the following hypothetical person:
- Is a shopaholic, so proximity to a main shopping center is paramount
- Needs to live near a main route to get to work/mall
- Would like to be close to a firehall, for safety's sake, just like the other person
- Doesn't use transit or ride a bike, so those things are not important
The eigenvector of weights is :Running MCE with these weights produced the equally compelling image below:
mainfuzz : 0.1886
sidefuzz : 0.1087
bikefuzz : 0.0442
skytrnfuzz : 0.0500
parkfuzz : 0.0630
shopfuzz : 0.2278
firefuzz : 0.1762
busfuzz : 0.0620
waterfuzz : 0.0795
Consistency ratio = 0.05
Consistency is acceptable.
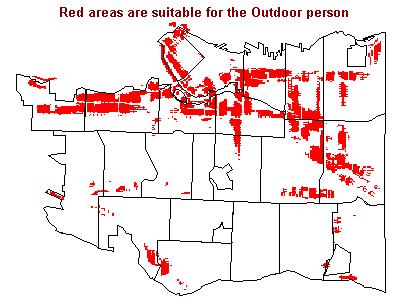
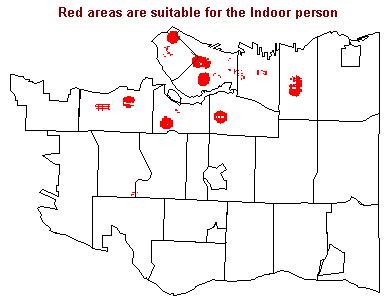
My final step was to RECLASS both of these images to identify spots where the suitibility was above a certain value. I choose 175 out of 256 as this value and reclassified the images as such. Here are the results:
RECLASS of the Outdoor person's map: RECLASS of the Indoor person's map:
[Previous Page
] [Next Page
]