 |
DATA:
In
this section, the process of getting the data into an useable format will
be explained.The steps taken in
the actual analysis will be explained in the methodology section.
To view the
actual layer, click on the name.
Received
a municipalities coverage in MapInfo
format (UTM Zone10, nad83).
Using
MapInfo,
queried "Burnaby", reprojected (Albers BC project, nad83), buffered
1km.

COVERAGE
HOLES:
A
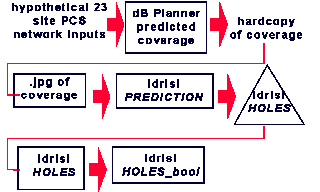
hypothetical PCS network was developed in dB
Planner.This is a MapInfo
extension that is used by PCS carriers to predict their network coverage.dB
Planner takes into account land use and elevation to determine the RF signal
loss through space.For this project,
23 sites were created in the study area.They
were given typical PCS antenna beam widths and heights.
Because
of software limitations, this image was not available for direct export
into IDRISI format.The
image was printed out into a hardcopy.
This
image was then digitally scanned and converted to a '.jpg'.
This
'.jpg' was georeferenced (Albers BC project, nad83) in IDRISI.
Coverage
holes were then digitized in IDRISI,
clipped to study area.
EXISTING
SITES:
Exported
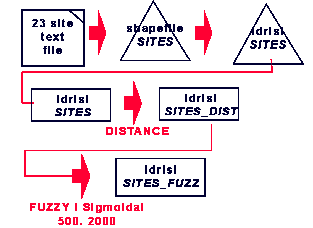
from dB Planner as
text file (UTM Zone10, nad83).
Created
shapefile in ArcView, reprojected (Albers
BC project, nad83), clipped to study area.
Rasterized.
DISTANCE
function performed in IDRISI.In
this step, a layer is created where every pixel's Z-value is the distance
to the closest existing PCS site.
FUZZY
function performed in IDRISI.In
this step, the distance values created in step 5 are standardized to an
increasing sigmoidal curve with control points at 500m and 2000m.This
means that from 0 - 500m the suitability of a new site is nil.
To see this image, click here.From
500 to 200m, the suitability increases.At
2000m from an existing site and further, the suitability will not change.
DEM
- ELEVATION:
Received
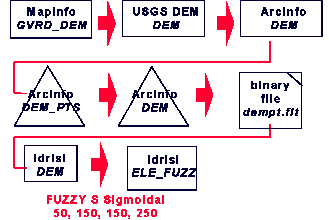
30m DEMin MapInfo
format (UTM Zone10, nad83).
Used
ArcInfo
'PROJECT' (Albers BC project, nad83).
Used
ArcInfo
'CLIP' to clip points to study area.
Used
ArcInfo
'GRIDFLOAT' to export grid in binary format.
Imported
binary file into IDRISI.
FUZZY
function performed in IDRISI.In
this step, the elevation values are standardized to an symmetric sigmoidal
curve with control points at 50m , 150m, 150m and 250m. This means that
below an elevation of 50m, the suitability is nil.From
50m to 150m the suitability increases. From 150m to 250m the suitability
decreases to nil.
SLOPE:
SLOPE
function performed on DEM in IDRISI.In
this step, the slope of every pixel is calculated in degrees based on the
Z-values of the layer.
FUZZY
function performed in IDRISI.In
this step, the slope values are standardized to an decreasing sigmoidal
curve with control points at 5 and 15 degrees.This
means that slopes below 5 degrees all have a high suitability.From
5 to 15 degrees, the suitability decreases.After
15 degrees, the suitability is nil.

LAND
USE:
Received
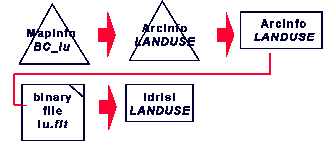
in MapInfo format (UTM Zone10,
nad83).
Converted
to ArcInfo coverage using FME, reprojected
(Albers BC project, nad83), clipped to study area.
Used
ArcInfo
'POLYGRID' to create ArcInfo grid.
Used
ArcInfo
'GRIDFLOAT' to export grid to binary format.
Imported
binary file into IDRISI.
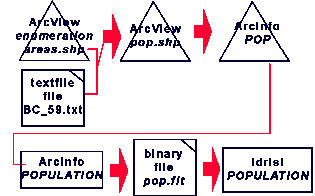
POPULATION:
Received
enumeration areas as shapefile (UTM Zone10, nad83).
Received
population data as textfile.
Linked
data to shapefile in ArcView.
In
ArcView,
reprojected (UTM Zone10, nad83)), clipped to study area.
Used
ArcInfo
'SHAPEARC' to create ArcInfo coverage.
Used
Arcinfo
'POLYGRID' to create ArcInfo grid.
Used
ArcInfo
'GRIDFLOAT' to export grid in binary format.
Imported
binary file into IDRISI.
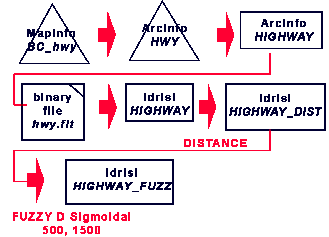
HIGHWAYS:
Received
in MapInfo format (UTM Zone10,
nad83).
Converted
to ArcInfo coverage using FME,
reprojected (Albers BC project, nad83), clipped to study area.
Used
Arcinfo
'POLYGRID' to create ArcInfo grid.
Used
ArcInfo
'GRIDFLOAT' to export grid in binary format.
Imported
binary file into IDRISI.
DISTANCE
function performed in IDRISI.In
this step, a layer is created where every pixel's Z-value is the distance
to the closest pixel containing a highway value.
FUZZY
function performed in IDRISI.In
this step, the distance values are standardized to a decreasing sigmoidal
curve with control points at 500m and 1500m.This
means that suitability within 500m from a highway is high.From
500m to 1500m the suitability decreases.After
1500m, the suitability is nil. To see
this image, click here.
WATER:

[
Introduction
] [ Overview ] [ Data
] [ Methodology ] [ Analysis
] [ Results ]
[
Image
Gallery ] [ Contact Me ] [
Links
]
|


