Methodology - Noise
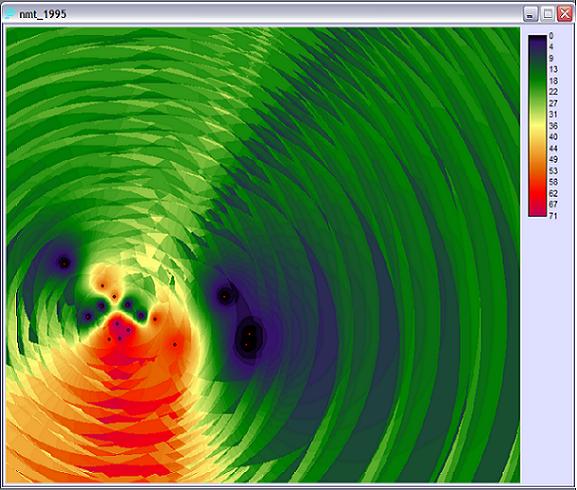
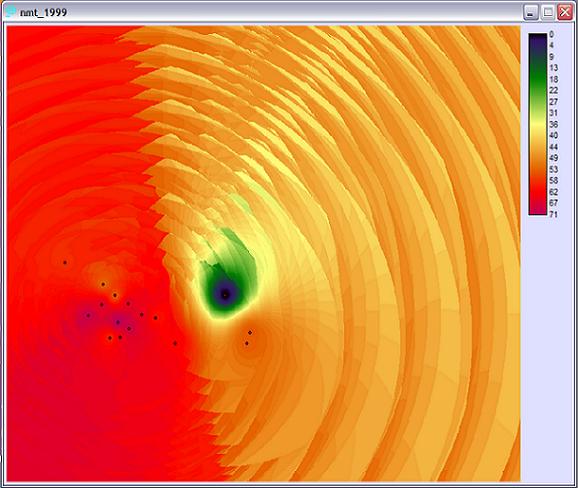
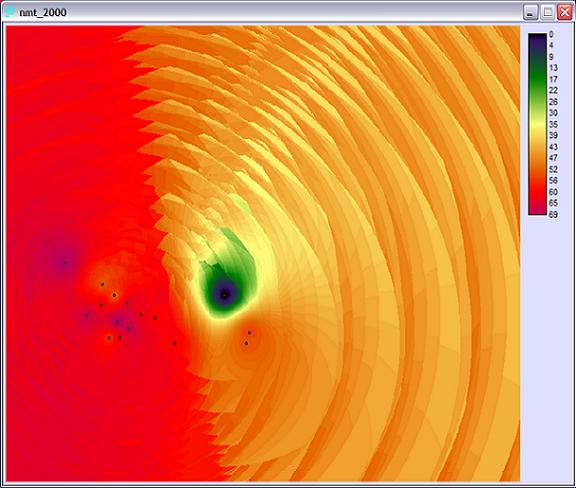
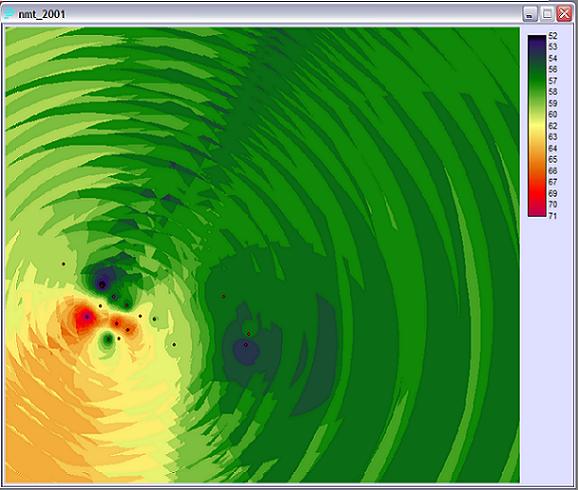
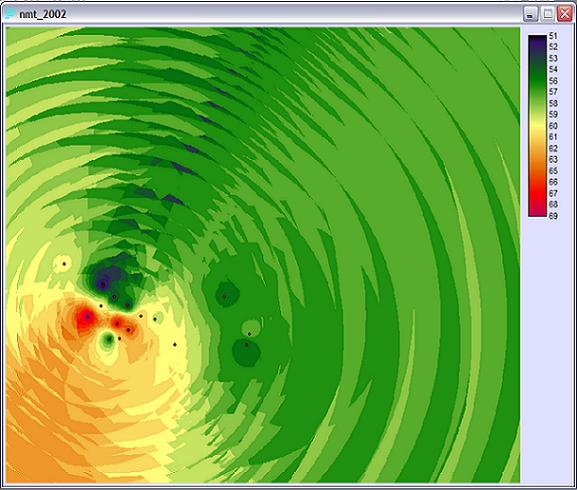
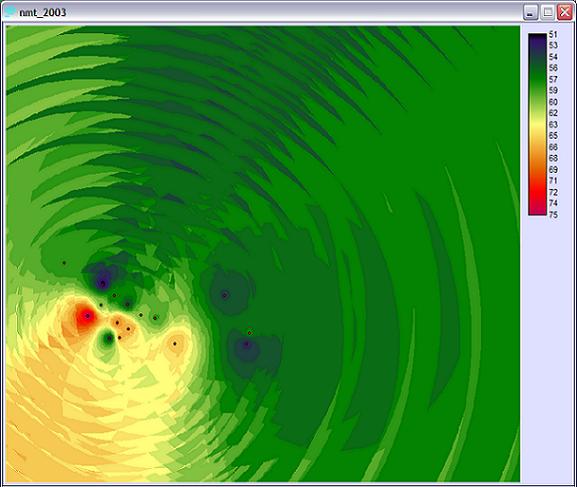
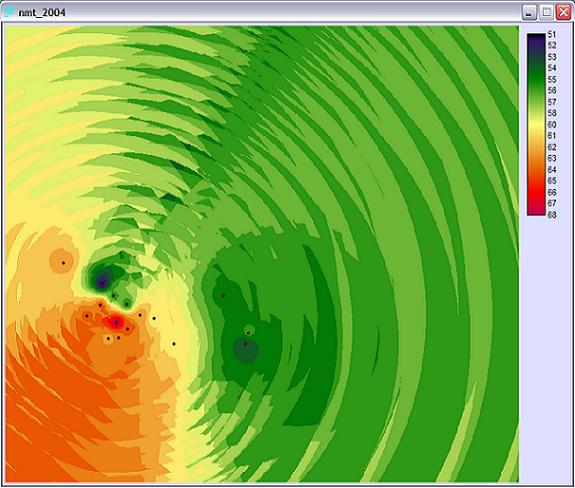
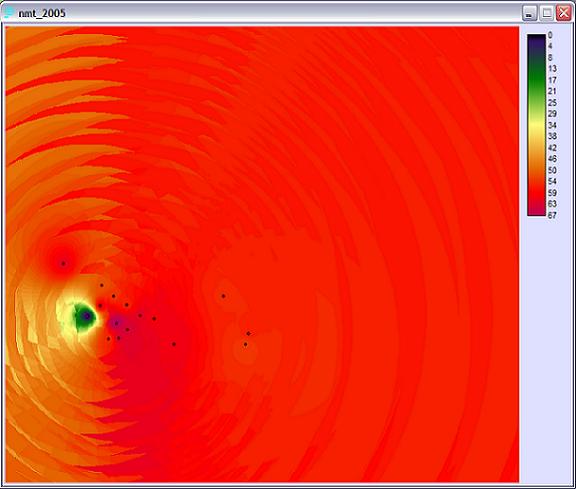
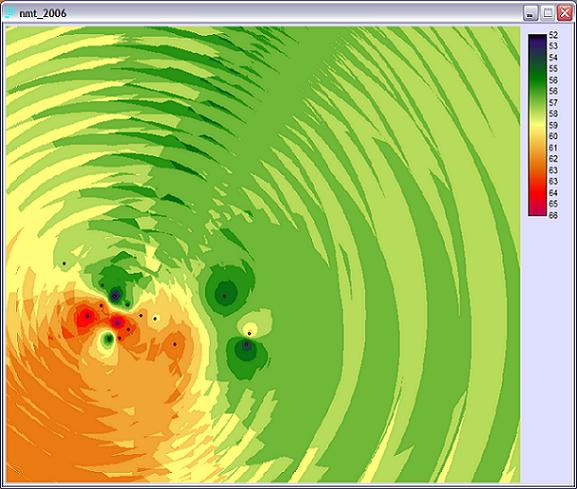
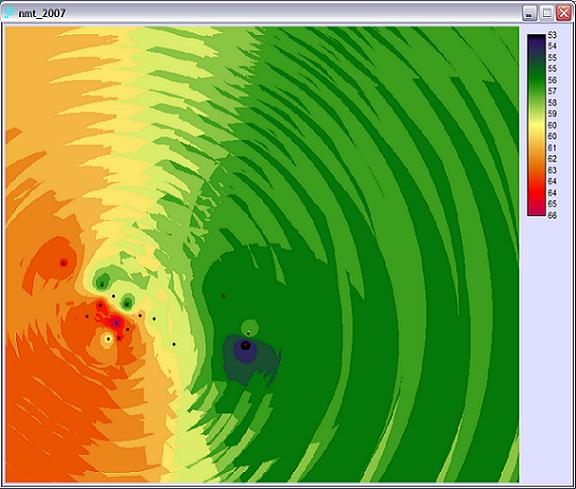
Similar to air quality, noise is a type of point data. Noise data command interpolation for their intensity, so the 'interpol' module is used to fulfil this purpose. The analysis takes the data of thirteen years into consideration and thus procures thirteen interpolated images. The red dots are NMT's, and they are added to images to strengthen the spatial reference of noise radii.
Noise 1: Year 1995
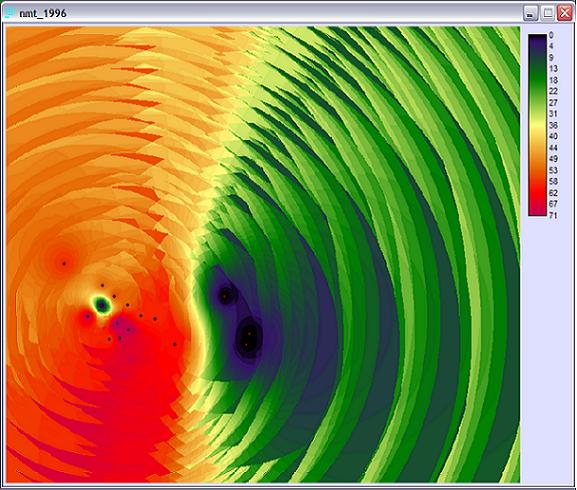
Noise 2: Year 1996
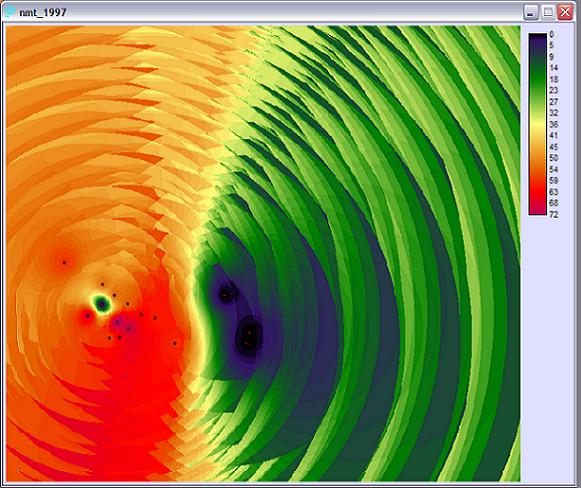
Noise 3: Year 1997
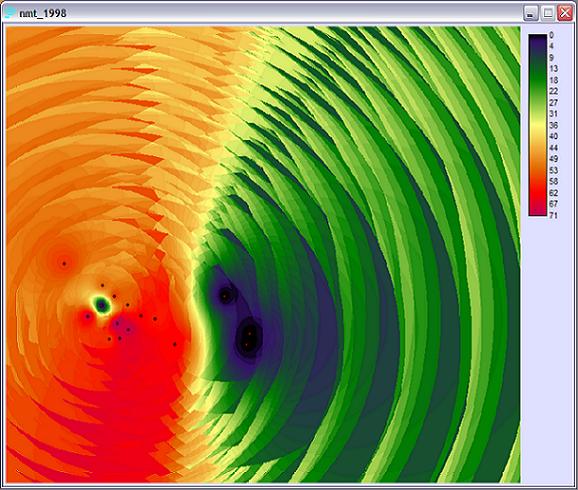
Noise 4: Year 1998
Noise 5: Year 1999
Noise 6: Year 2000
Noise 7: Year 2001
Noise 8: Year 2002
Noise 9: Year 2003
Noise 10: Year 2004
Noise 11: Year 2005
Noise 12: Year 2006
Noise 13: Year 2007
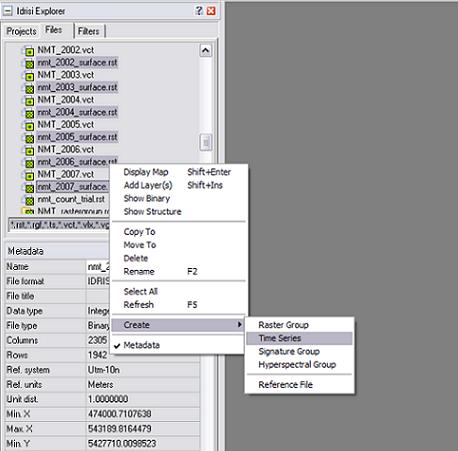
To show the overall changes of noise radii over the 13-year period, the module of 'time-series analysis' (TSA) can make interpolated images applicable to spatial analysis. Before executing the module, it is important to create a time series file (.ts) as its input image. The time series file requires input files as those that are highlighted in the image below (for example, nmt_2002_surface.rst).
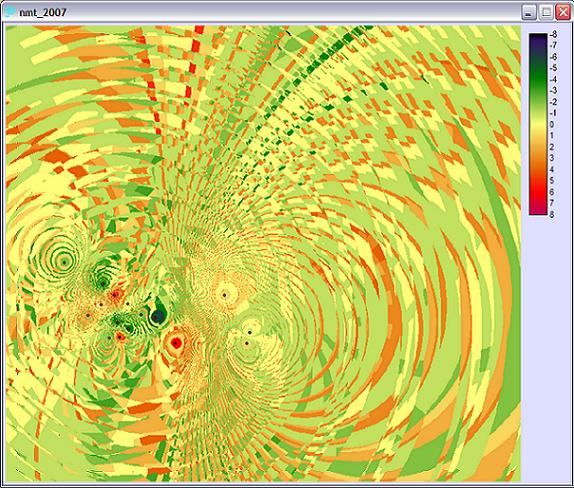
After the time series file was made and TSA executed, images showing the changes of a period of time will appear. The amount of resulting TSA images will be identical to the amount of input file. The final image aggregates all changes over the observing years, so it will be used as a factor image for spatial analysis.
Next: Spatial Analysis
Back: Methodology