Data Collection
The location examination of Vancouver International Airport utilizes an array of data from various sources. The data are provided by SFU, along with some that are extracted from non-academic sources. These are the following:
- From S drive of SFU (ESRI shapefiles):
- in the Translink folder of Data Warehouse folder:
1) busroute.shp
2) busexchange.shp
3) skytrainroute.shp
4) skytrainstation.shp - Digitization based on a GVRD municipality shapefile (muni.shp) with ArcMap in S drive of SFU:
1) airport.shp (polygon)
2) Canada_line.shp (line)
3) Canada_line_stations.shp (line) - From S drive of SFU (IDRISI files):
- in 355-Data lab folders:
1) gvrd_lu_2001.rst
2) bchwy.rst - Digitization based on the 2001 GVRD landuse raster file (gvrd_lu_2001.rst) with IDRISI:
1) National Air Pollution Surveillance (NAPS) stations (point)
2) Noise Monitoring Terminals (NMTs) (points) - Non-academic sources:
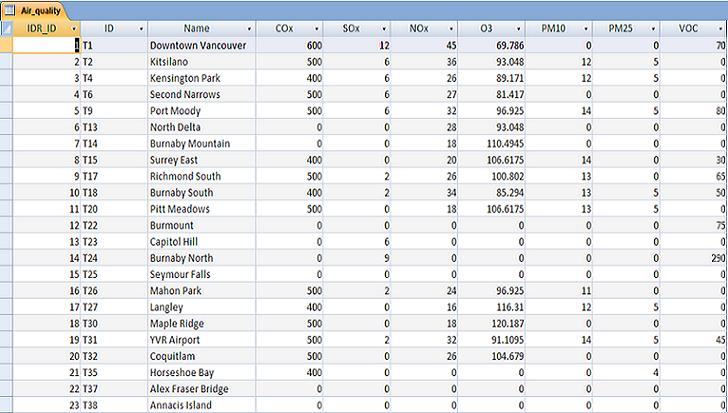
1) air quality based on the Lower Fraser Valley Ambient Air Quality 2006 Report (Air Quality Monitoring Network, n.d.): air quality assessments and measurements are used to create a database file with MS Access 2007. This database file includes the measurements of carbon monoxide, nitrogen oxides, sulphur oxides, particulate matter≤10 micrometers (µm), particulate matter≤2.5µm, ground-level ozone and volatile organic compounds (VOC). There are 23 instances of database because there are 23 NAPS monitoring stations in GVRD. This database is later vector-linked to the NAPS stations discussed above.
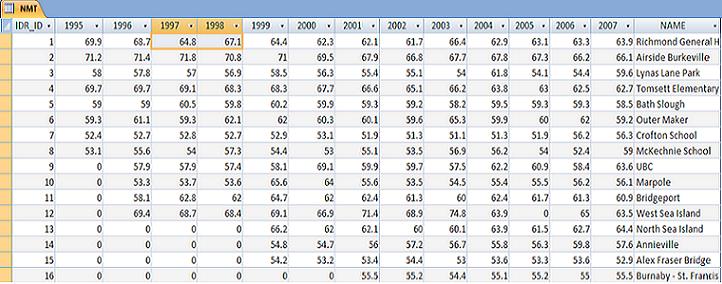
2) noise level found at YVR Airport website (Vancouver Airport Authority, n.d.): noise measurements are used to construct a database file with MS Access 2007 (click here to see file), and the file contains noise measurements recorded at 16 noise monitoring terminals (NMTs) across GVRD. Most measurements aggregated in the table are 10-year records at NMTs. This database is later vector-linked to the NMTs discussed above, too.
Next: Methodology