There were a number of assumptions that I necessarily made to simplify this project.
1. I assumed that all available land for agricultural use was equally suitable and operating at full capacity. Considering that the scope of my study was so small and that much of the promoted agricultural activity is independent of soil type and precipitation level, this is not a gross oversight. However, the only yield data I was able to obtain was for dedicated farm plots which may not be an indicator of container or balcony gardening yield potential. This represents a data gap in that I know of no study comparing yields from traditional farming and urban farming. Moreover, I somewhat arbitrarily compensated for the reduced yields by cutting the land area used in my calculations. In my calculation of Level 1 areas, 100% of the land was included, compared to only 25% of Level 2 areas and 15% of Level 3 areas. My rationale is that Level 2 and Level 3 areas are mixed-use zones and the space available for agriculture is increasingly marginal. A more accurate study would determine the total lawn and balcony space in the GVRD, rather than relying on a best estimate based on my own backyard and neighbourhood . It should be noted that a similar assessment of backyards in Vancouver concluded that in a single-family parcel, roughly 30% of that space could be used for agriculture, so my estimate is not unrealistic (City Farmer, 2001). I opted to not use their estimate simply because the area I am considering includes multi-family residences which may have less space available.
2. I assumed that all food produced was distributed evenly amongst the population and did not examine any of the justice or personal choice issues which affect access to food. This is a significant concern and any future study on food security in the GVRD would benefit from some form of distribution model.
3. The diet of an individual is highly idiosyncratic and the amount of food calories produced in an area is dependent on the foodstuff grown or raised. My 1500 Kcal value for calorie production per land parcel is based on an average of production values for meat, vegetable, grain, and root harvests (Vegan Society, 2003) and may not be an accurate portrayal of the amount of food actually produced in the GVRD. Moreover, I based my analysis on a 2,000 calorie diet and did not account for intake variance based on age or gender. The calculation I used to determine how much land is required to feed one person was as follows:
1500KCal/0.05km x 2000KCal/X = 0.07 km of land required to feed one person for a day.
4. Seasonal and economic factors heavily influence what food is available when, where, and for whom. This study assumed that all foods requisite to a healthy diet are produced year-round and did not account for farm lands which are used to grow non-food cash crops, such as the 1000 hectares of turfgrass sod grown in the Lower Mainland (Ministry of Agriculture and Lands, 2001). This is a significant assumption as there is a considerable difference in the amount and variety of foods produced in the summer versus the winter. Moreover, farms often operate with fields in a fallow cycle, meaning that at any given time a percentage of available farm land is not in use. Fallow periods are necessary to maintain land fertility and recognition of such would allow for a more rigorous evaluation of regional food production levels.
5. As this analysis is considering our (the GVRD’s) ability to independently provide food for ourselves, I did not consider flows of food in or out of the region. In reality, the GVRD does not exist in a vacuum; we import and export food, regionally, provincially, nationally, and internationally. At this initial phase of study, I was only interested in our base capacity to produce food, but an interesting follow-up study could investigate import and export routes to compare scenarios of selected supply loss. For instance, the GVRD produces no wheat and depends on regular supply from the Prairies (USDA, 2006). It would be interesting to see the effect on our region if that line of trade were disrupted.
I encountered many little operational problems in the course of this project, most of which are not noteworthy. Two significant problems that I was unable to overcome are listed below.
Though I had compiled a thorough geocoded inventory of all farms in the GVRD, I was unable to use this data in Idrisi as I could not make it compatible with my existing map data. My primary base map had a resolution of 250 meters, which was too low to represent my point data of individual farms. When I attempted to create a raster version at this resolution, my farms coalesced into one giant point which covered the entire region. Clearly, this was unacceptable. This problem could have been corrected through the use of a higher resolution GVRD map; however, as this information was not crucial to my analysis, I opted to leave it in vector format as a shapefile and display it using ArcMap.
I was ultimately unable to create agricultural ‘density’ maps. My goal was to produce a map which detailed the amount of food produced (as measured by land area) per person. This conceptually inverted traditional density measurements which would look at events/items per area to look instead at the area (food) per population. My idea was that a ‘density’ measurement less than 1 represented food insecurity, a measurement of 1 meant adequate food supply, and that a measurement greater than 1 indicated a food surplus within the region. In attempting to do this, I encountered two problems.
1. I was interested in the ‘density’ of the GVRD as a whole and was therefore using a regional population value rather than one delineated by municipality or census area. The maps produced show that the ‘density’ of agricultural areas was higher than in other parts of the region. While this is true, it is not useful to my analysis. I was not comparing density shifts within the region, but was interested in the overall level density increased when more land was available.

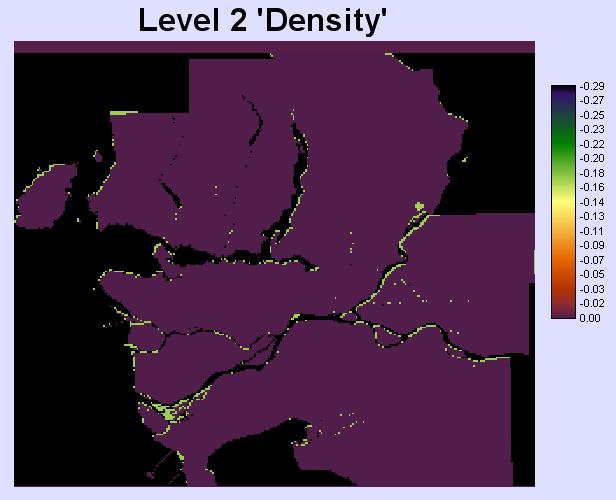
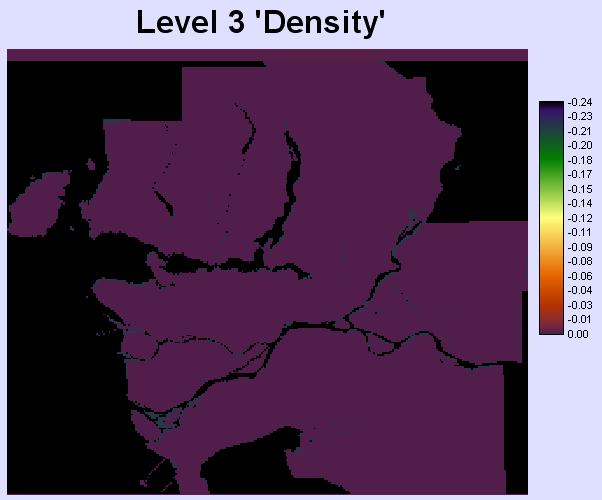
2. Using the maps, I was unable to adjust my land area value to account for mixed-use zones. In other words, I was unable to complete my calculations using only 25% (for Level 2) and 10% (for Level 3) of my land area. Similarly, the values produced were misleading as there is not a 1:1 relationship between square kilometer of land and enough food to feed one person. Based on a 2000 calorie diet, this relationship is actually closer to 0.07:1.0.
I am not sure how these issues could have been resolved and had to rely on manual calculations made outside Idrisi.
<BACK |
^TOP |
NEXT> |