This first flow chart represents the conversion of ESRI data into a useable form in IDRISI.

Digitizing objects for use
in later steps.
Translating into IDRISI format files.
Converting to Raster format for manipulation by IDRISI modules.
Translating into IDRISI format files.
Converting to Raster format for manipulation by IDRISI modules.
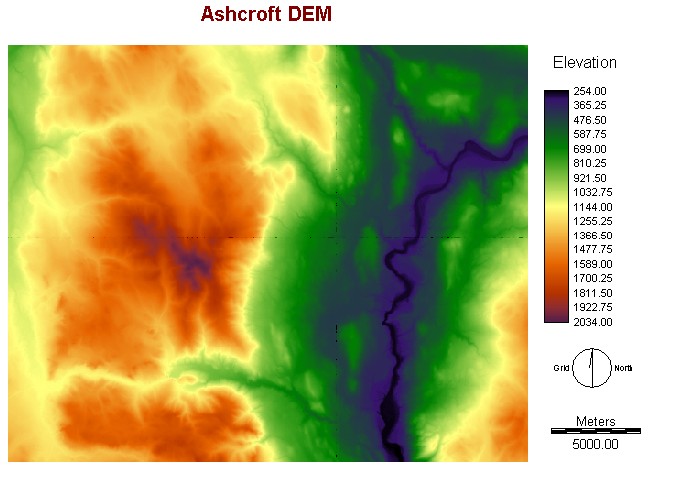
This is the result of the WINDOW
module, as this was only a small portion of the original DEM that was
obtained.
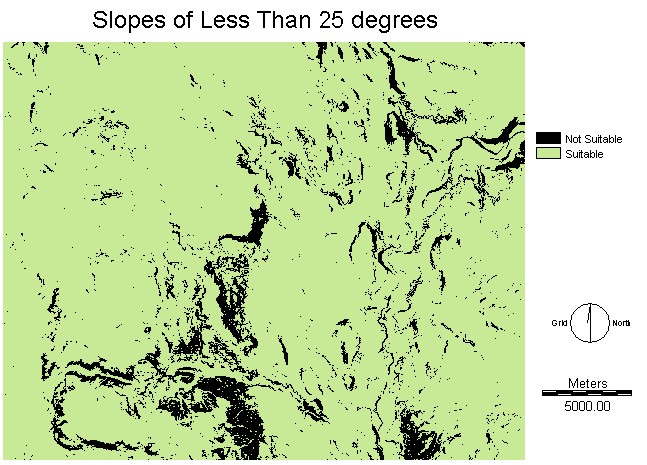
This is the result of the SLOPES
module which was followed by RECLASS in order to have the data in a
format suitable for the MCE in later steps.
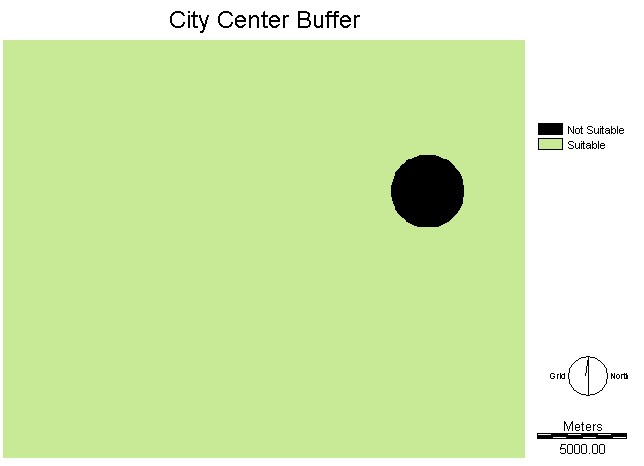
The Black area indicates the 2
kilometer buffer around the center of town.
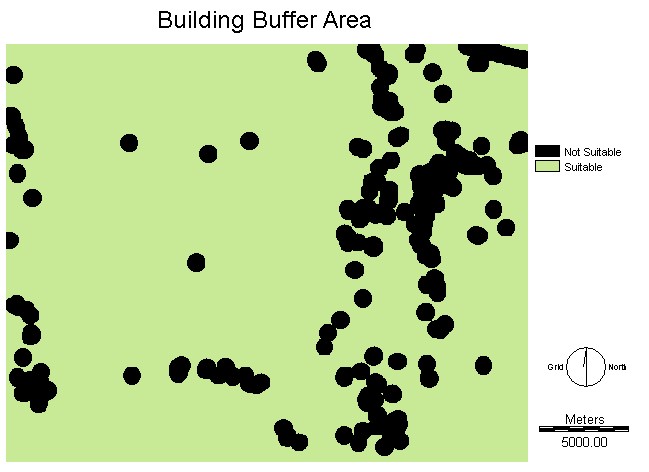
All these points represent
buildings that were in the tculp shape file.
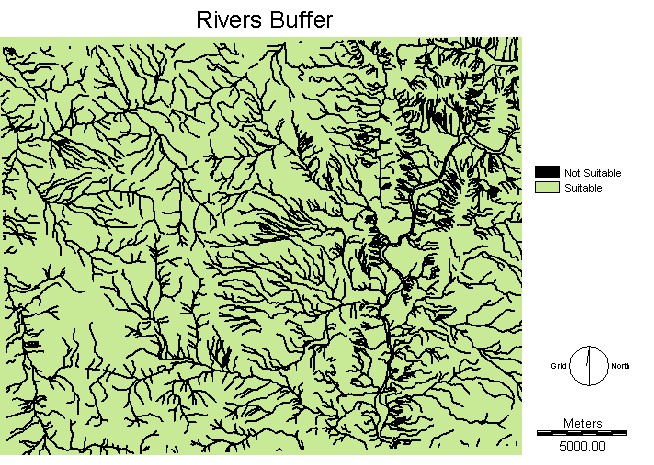
All the regions in black are
rivers, streams and a 50m buffer around each of them to ensure they are
not disturbed by the construction of any wind turbines.
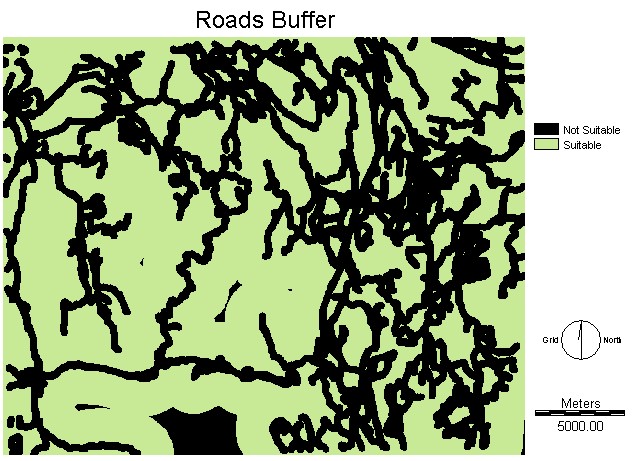
This is the result of the road buffer which excluded areas less than 200m from the road and areas greater than 2000m from the road.
This section shows the steps used to find the basic areas which are suitable for wind sites. The resulting file indicates land which is more than 2000 m from the city center, more than 50 m from any building, more than 200 m from any river or stream, more than 200 m but less 2000m from a road and on terrain which has a slope of less than 25 degrees.

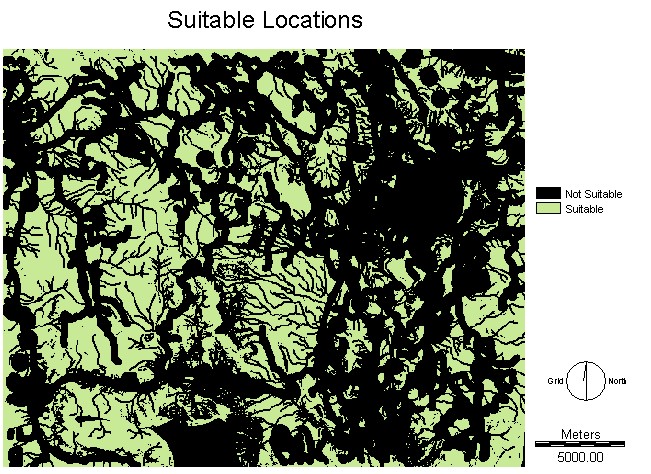
All the locations which are not
black meet all the criteria that was established with respect to the
safe and effective installation of wind turbines. The MCE
evaluation in the Spatial Analysis takes this one step further by
including the importance of some of the factors used in the criteria.