Conceptual Outline
Data Collection
Methodology
Spatial Analysis
Discussion
Cartography Map - Part I
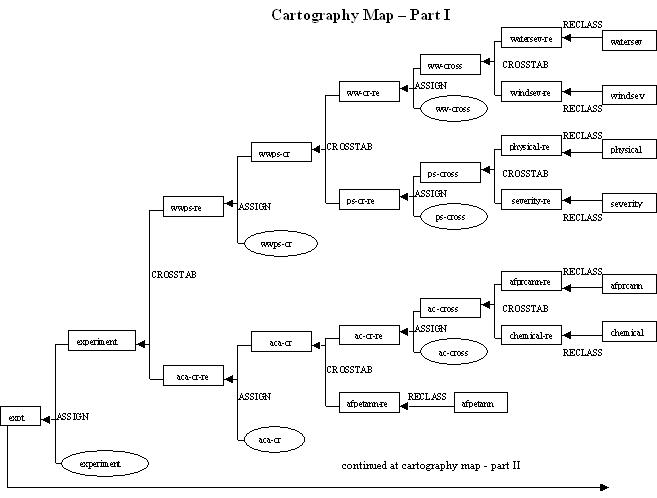
The values used for RECLASS of afpetann are:
[-2000, 0) 0 (background)
[1, 2000) 1 (non-experimental)
[2000, 9999) 2 (experimental)
The values used for RECLASS of afprcann are:
[-2000, 0) 0 (background)
[200, 9999) 1 (non-experimental)
[0, 200) 2 (experimental)
The values used for RECLASS of other 5 raster files are:
0 0 0
1 1 1
1 2 2
1 3 3
3 4 4
2 5 5
1 6 6
Note: 0-0 (background)
1-1,
2,3, 6 (Low, moderate, high, no effect of the severity)
2-5
(Lakes)
3-4
(Very high)
The values used for Assign the results of CROSSTAB are
first map second map
new value
meaning
1
1
1
(suitable)
2
2
2
(Lakes)
If either of the maps with value 3 cross with 1 or 3,
the result is 3 because as long as one factor is too sever for plant, it
should be assign to value 3 (not suitable). If any 0 cross with 2, the
result is 2 since in some maps the value of the lake is the same as the
background 0. If 0 cross with 1 or 3, it is still 0.
Cartography Map - Part II
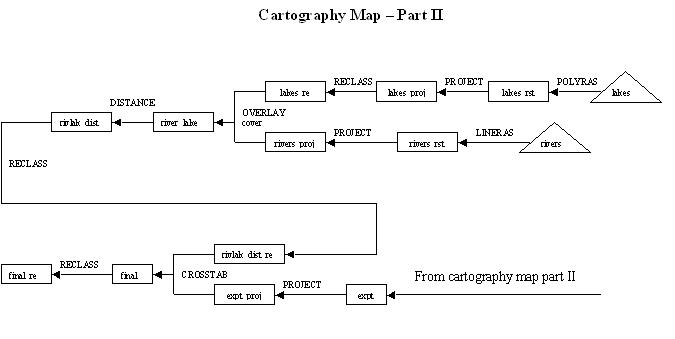
Values to RECLASS lakes_proj:
[0,0) 0 background
[1, 99999) 1 lakes
Values to RECLASS rivlak_dist:
[0, 0.1) 0 rivers or lakes
[0.1, 20) 1 experimental areas
[20, 99999) non-experimental areas