Conceptual Outline
Data Collection
Methodology
Spatial Analysis
Discussion
Spatial analysis
Result Summary from Cartography Map Part I
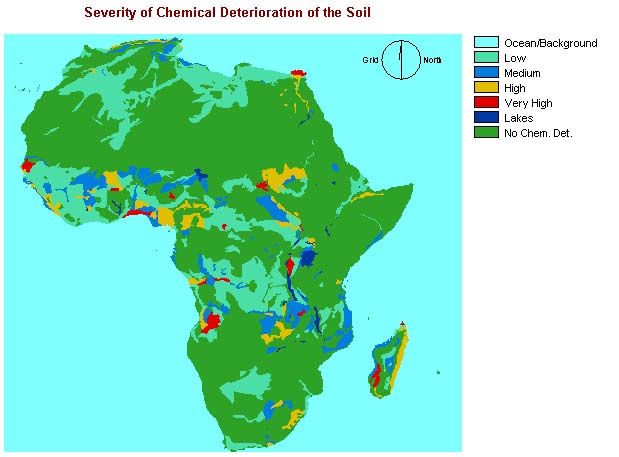
This map shows the original raster file of the severity
of chemical deterioration of the Soil
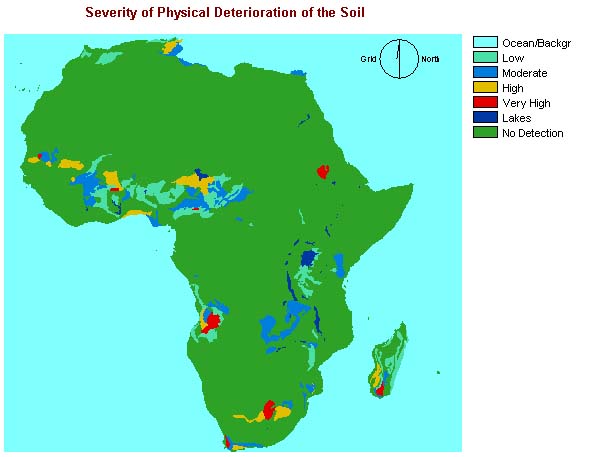
This map shows the original raster file of the severity
of physical deterioration of the Soil
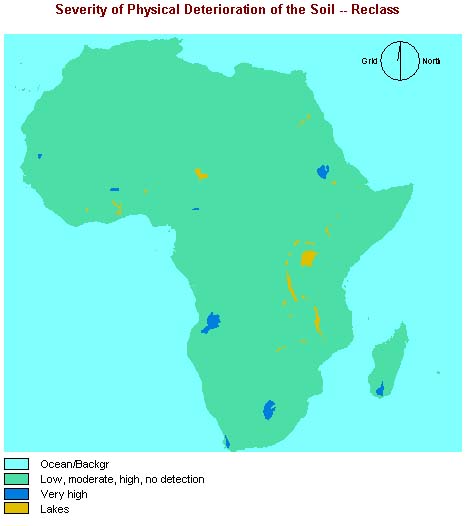
After RECLASS the physical map, we can see that the areas
in severial physical deterioration.
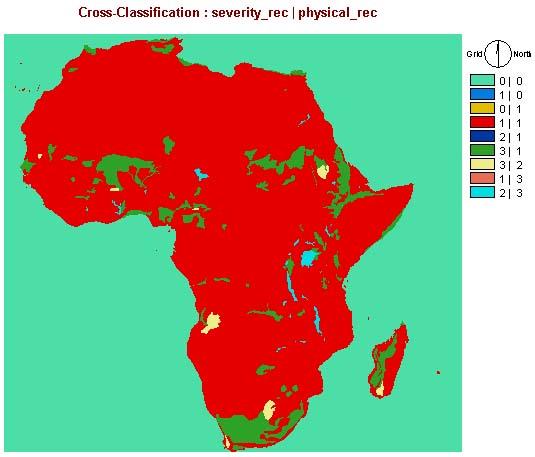
After the result CROSSTAB operation. It shows that most
of the areas are in good condition in terms of the severity of physical
deterioration and soil degradation.
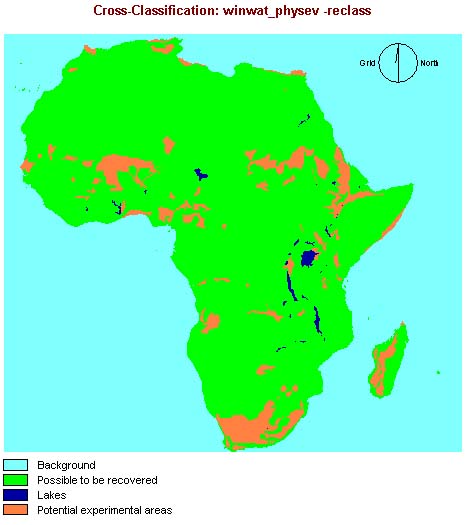
After RECLASS the CROSSTAB result of 2 maps, it shows
the areas that are in good condition in terms of severity of wind effects
on soil and water erosion.
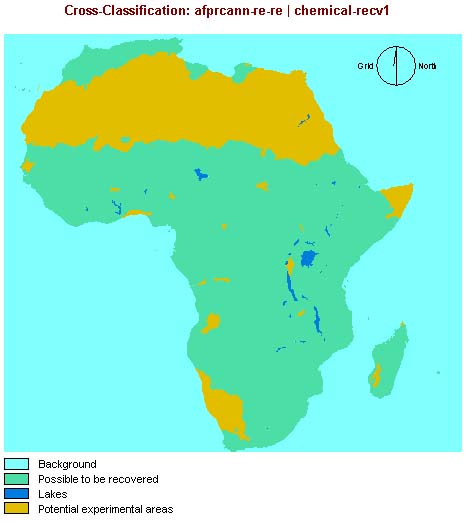
This maps shows that there are a lot of areas that are
in good condition in terms of severity of chemical deterioration of the
soil and mean annual precipitation.
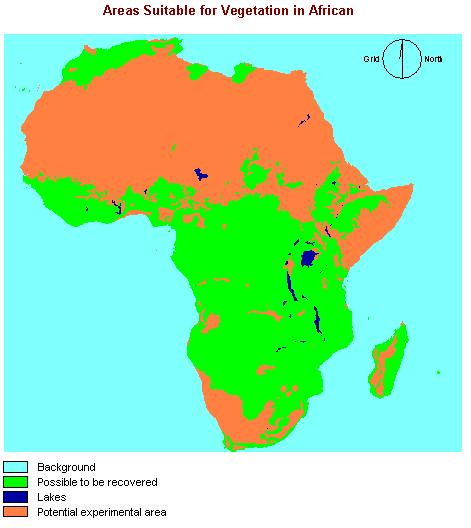
The map shows that most areas are in good condition in
terms of mean annual potential evapo-transporation, chemical deterioration
of the soil and mean annual precipitation, the severity of wind effects
on soil, water erosion, physical deterioration and soil degradation
Results Summary from Cartography Map Part II:
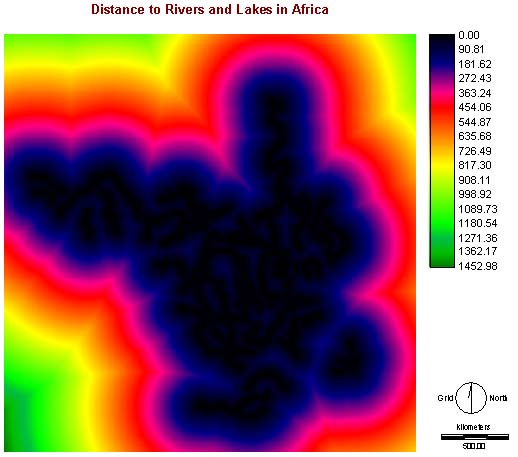
The areas covered by rivers or lakes (The following maps
are projected in kilometers, therefore, the scale bar is shown):
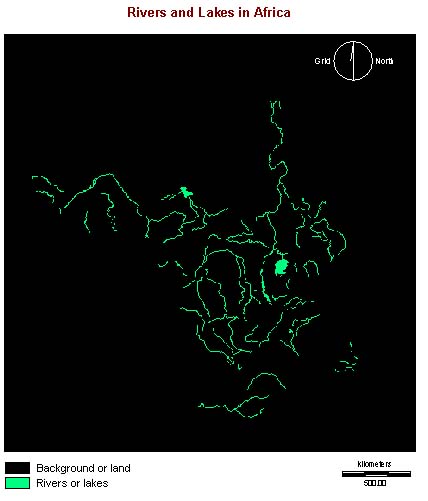
The maps shows the distance to rivers and lakes
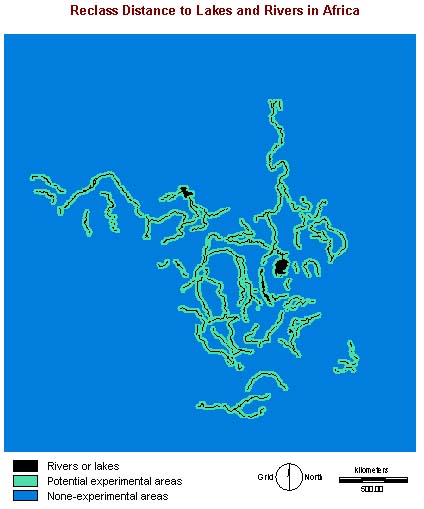
The maps shows the RECLASS of the DISTANCE map above:
The Maps shows the final result:
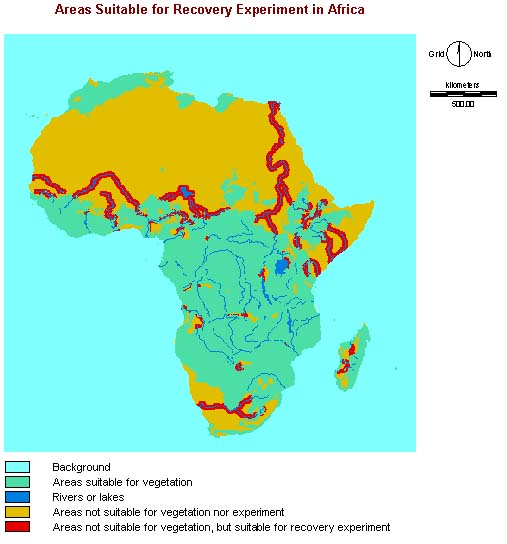
Conclusion:
The red areas shown are within 20 km of open water (rivers
or lakes) can be considered as the suitable areas for recovery experiment
for the future if land is in high demand.