 |
|

AnalysisThis section is divided into two parts: Part B: analysis of pyroclastic surge hazards.
Part A. Lahar Hazard AssessmentThis part consists of four steps:
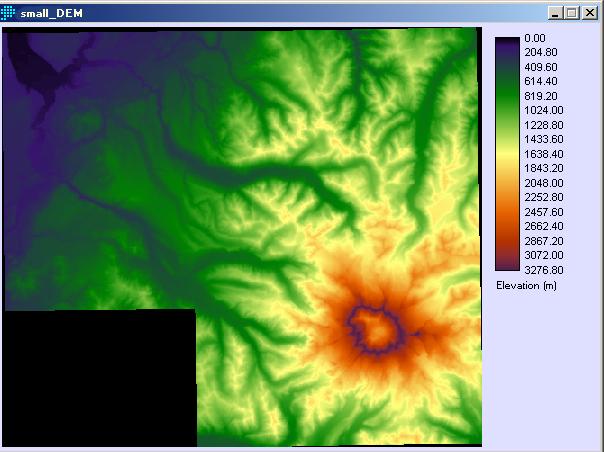
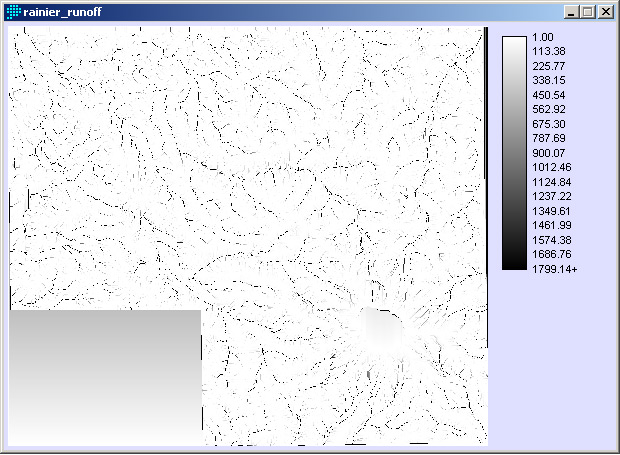
The maps produced in steps 2-4 were used as factors in a multi-criteria evaluation (MCE) of relative lahar hazard. 1. Identification of potential lahar channelsThe first step in this analysis was to identify river valleys with the potential to carry lahars. Because the lahars are expected to be generated from the glaciers around the summit cone of Mt. Rainier, only river valleys connected directly to the summit cone are considered for this analysis. Identifying these river channels using the only the DEM (below) proved surprisingly complicated, and the process is detailed as follows. The smaller DEM coverage of the study area (above) was used as the source terrain model for all of the manipulations in this section. First, the RUNOFF module was used to simulate the runoff through each pixel by determining the flow direction out of each pixel and adding 1 to each downstream pixel for all upstream pixels. Therefore, this module produced an image with relatively large values in the locations of stream channels. (Even using the smaller DEM, this operation took nearly half an hour.)
Next, the stream channel image was RECLASSed at an arbitrary threshold to produce a binary image with a coarse stream channel network (runoff_binary below; streams are delineated by pixels with a value of 1).
Next, the stream channels connected to the summit cone had to be isolated. Since this was impossible in IDRISI, the runoff_binary image was converted to vector with RASTERVECTOR and exported to ESRI shapefile format (below) using SHAPEIDR.
Then, the WATERSHED module (below) was used on the small DEM to allow watersheds draining directly off the summit cone of Mt. Rainier to be detected. This was also exported to ESRI shapefile format.
In ArcView, the stream channel network and watershed files were imported and all watersheds immediately downstream of the summit cone were manually selected. Stream channels within these watersheds were selected and the lower-order side channels were removed from the selection. Then this simplified stream channel network was imported back into IDRISI (below). Only a few trunk streams draining directly from the summit cone remained (these are expected to carry lahars if an eruption occurs).
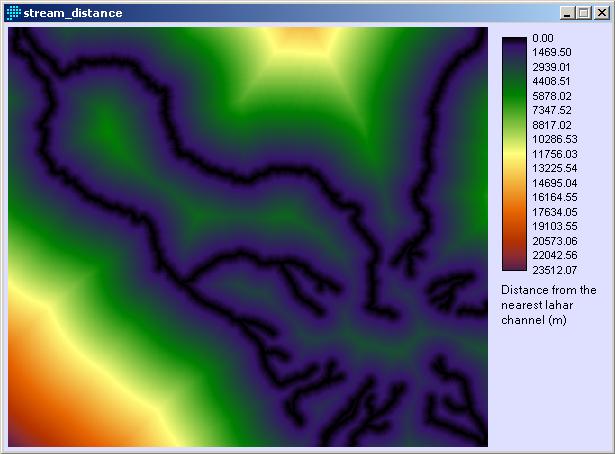
DISTANCE was used on the simplified stream channel image to produce one of the factors in the MCE (stream_distance, below).
3. MCE Factor 2: Height above the nearest lahar channelTo determine the height of each pixel above the nearest lahar channel, the small DEM image was multiplied by the simplified streams image. This produced an image with elevation values for each point along the lahar channels, and zeroes everywhere else (below).
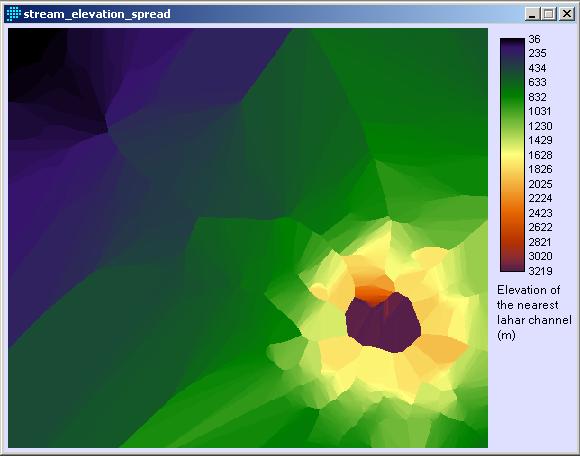
Next, I used the THIESSEN module on the above image to fill the entire surface with the nearest non-zero value. This produced an image (below) where each pixel had the elevation value of the nearest lahar channel segment.
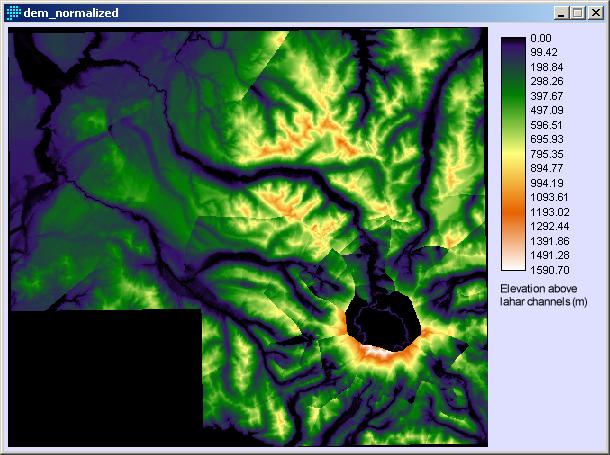
Next, I subtracted the image above from the small DEM image. This produced a "normalized" DEM with each pixel containing the height above the nearest lahar channel (below). In other words, the base level or datum for this image was the height of the lahar channel network.
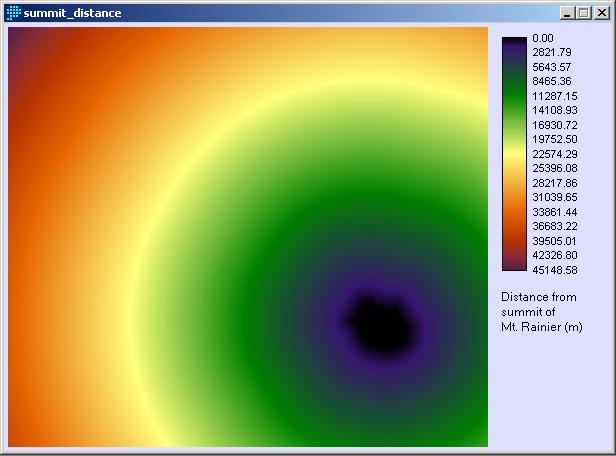
4. MCE Factor 3: Distance from the summit of Mt. RainierThe distance factor was created by digitizing a line along the edge of the summit crater (the approximate source for lahars) and using the DISTANCE module (below).
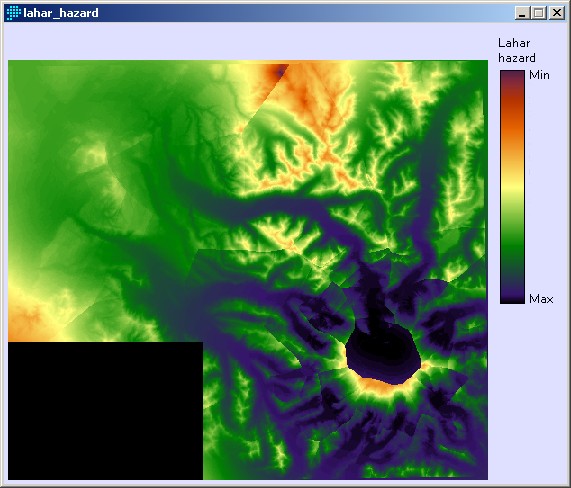
These three factors (distance from lahar channels, height above lahar channels, and distance from eruption source) were combined into an MCE using the decision support wizard. Distance from the lahar channels and height above the lahar channels were weighted equally, at 0.45. This gives a realistic portrayal of the dimensions of lahar channels for particular flood levels. Distance from the eruption source was weighted at 0.1, because lahars can travel very long ditances. Essentially, I set the factor weights so that the resulting map of lahar hazard potential looked realistic, given the terrain. The image below shows the lahar hazard assessment image. (See more in the Results page.)
Next: Analysis Part B >> |