 |
| Results & Discussion |
| I. In this first section, I am going to present
maps showing the potential
distribution of Cocain, Heroin and LSD users in Vancouver. The higher the number the more likely it is that the area holds drug addicts. |
|
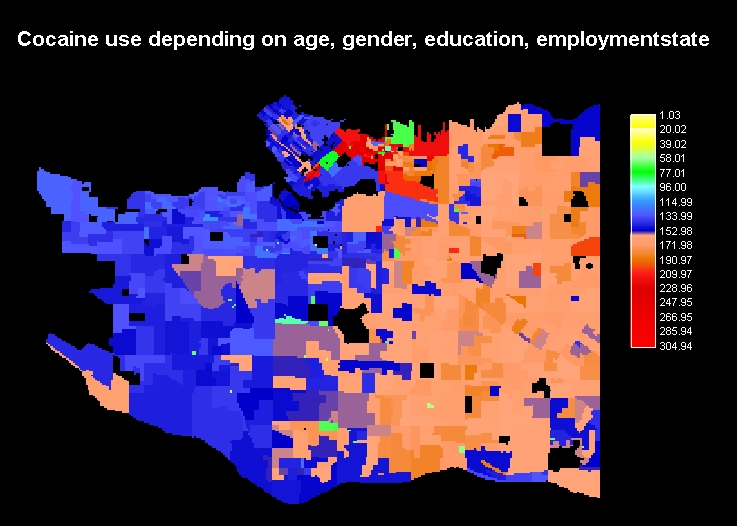
1. Which areas have the highest probability of holding cocaine users
determined from the distribution of the socio-economic factors age, gender, education, employment status |
|
| Clearly to be seen is the division of the city into an east and a west part . The west part because of holding higher educated people und a lower unemploymentrate is less likely to have a 'drug problem'. Clearly to be seen as well are Downtown Eastside and Gastown who are taking the maximum values of the scale - which is congruent with our actual picture of Vancouver : Main-and-Hastings and the Area east of it. |
|
2. Which areas have the highest probability of holding heroin addicts
determined from the distribution of the socio-economic factors age, gender, education, employment status |
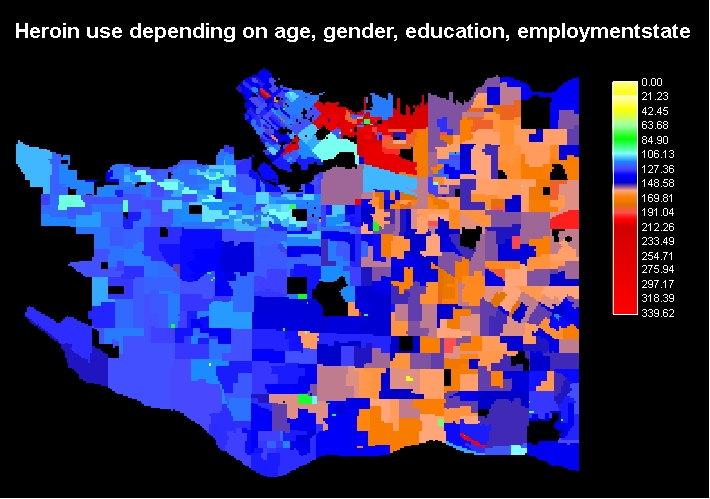 |
| Regarding Heroin, the bisection of the city is not
as striking as in the case of cocaine but it is still to be seen. Downtown
Eastside, Gastown and this time Chinatown as well leap to the eyes
immediately.
Kitsiliano, Fairview, Arbutus and Shaughessy take the lowest values of the scale. |
|
3. Which areas have the highest probability of holding LSD users
determined from the distribution of the socio-economic factors age, gender, education, employment status |
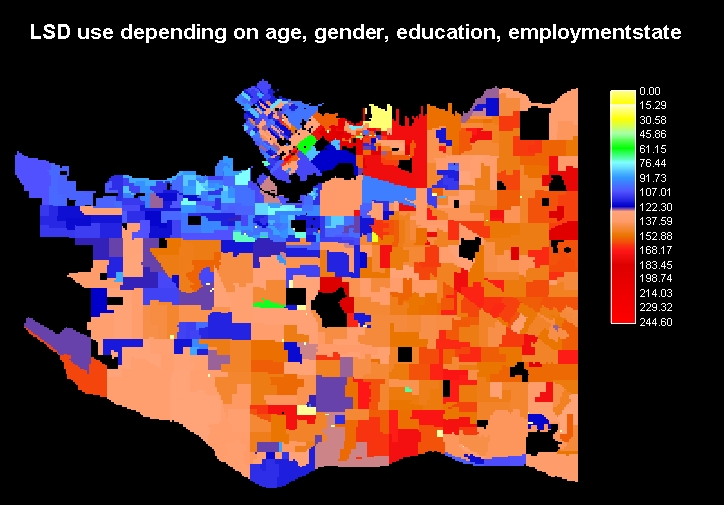 |
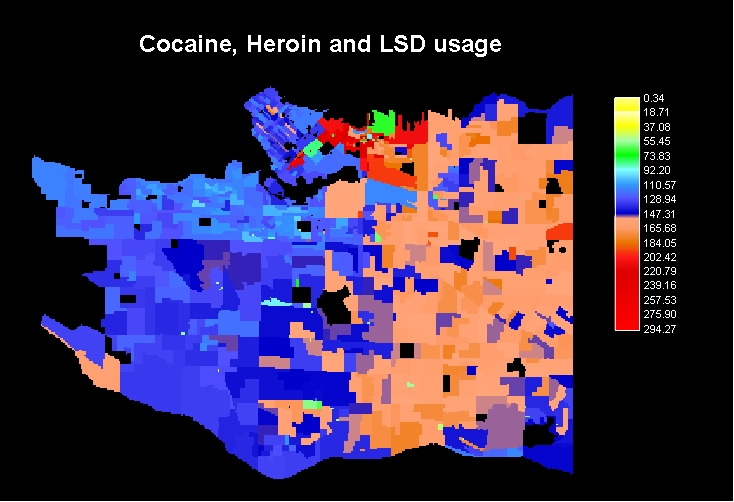
| With LSD the bisection of the city becomes further
unclear and the areas taking high values increase - not longer only Downtown
Eastside and Gastown.
LSD shows not such a clear spatial pattern as heroin and cocaine do because the use pattern is not as clear, too. The correlation between LSD and particular socio-economic criteria is less distinct than in the case of Heroin and Cocaine. |
| I did not provide a scale from
0 to 1 showing a probability in percentage because I wanted to maintain
the values in the scales of the three maps. The higher the maximum value
of the scale, the higher is the expressiveness of the map.
The height of the factors, which I used for calculating the scale numbers, reflect the strength of the correlation between the socio-economic criteria and the drug. The higher the factor the stronger the correlation. Consequently, the result of the whole calculating process is of the same nature: the higher the value, the stronger the correlation. What does this tell us about Heroin, Cocaine and LSD use? The maximum value of the LSD scale is the lowest while the maximum of the Heroin scale is the highest. Correspondingly, LSD is used by a broader public than heroin is. Therefore, heroin user are clearer to be spatially located because the connection to particular socio-economic criteria is stronger. |
|
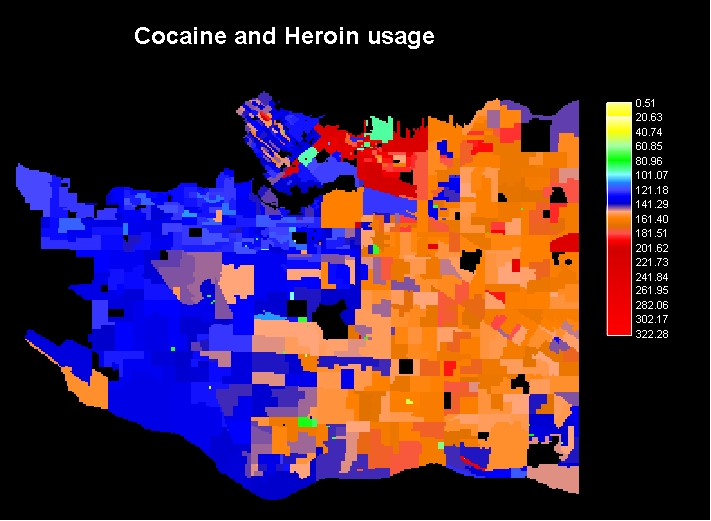
4. Which areas have the highest probability of holding
Cocaine and Heroin users determined from the distribution of the socio-economic factors age, gender, education, employment status |
 |
|
5. Which areas have the highest probability of holding
Cocaine, Heroin and LSD users determined from the distribution of the socio-economic factors age, gender, education, employment status |
 |
| As mentioned before, the correlation between Cocaine, Heroine and socio-economic criteria is higher. Consequently, the maximum value of the scale is higher, too. |
|
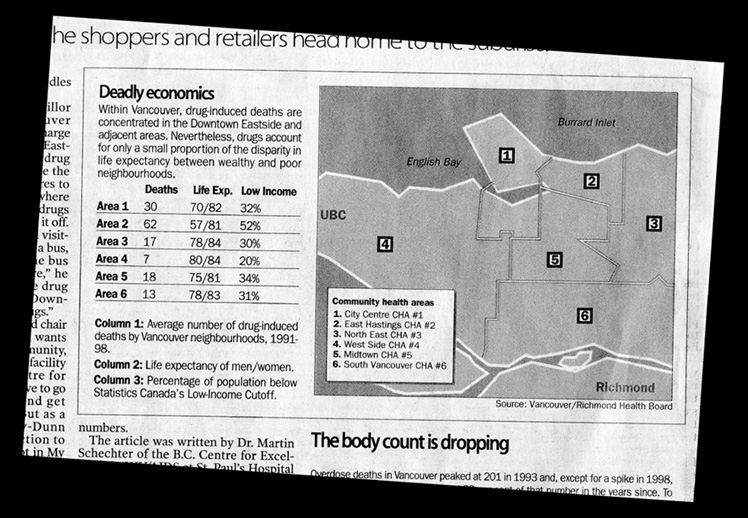
How realistic are my results?
Our intuition tells us, that the
results seem realistic - unfortunately, intuition is no appropriate scale
to measure truth. Coincidently, the Vancouver Sun published an article
about the distribution of deaths that are due to cocaine and heroin. Their
distribution map reflects excactly my results.
The highest numbers of deaths are
to be found in area 2 - Downtown Eastside and Gastown. These areas take
the highest values in my maps as well.
|
|
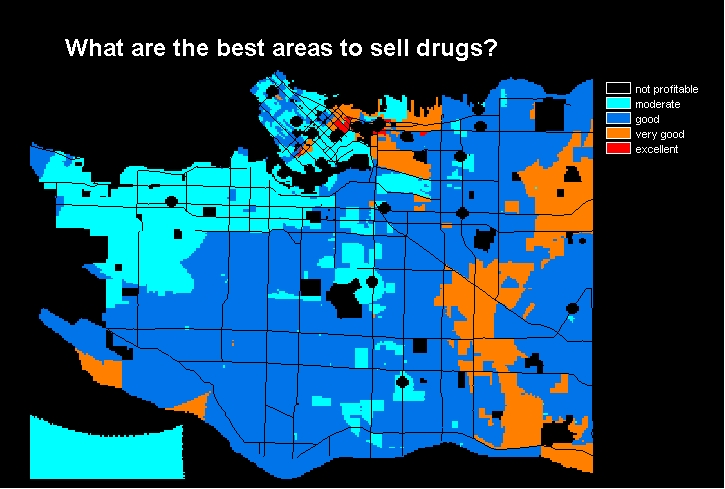
II. Market Analysis for Dealers
The intention of my second analysis part is to find out, which areas are best suitable for dealers to sell their drugs, based on numbers of customers and safety. |
 |
Discussion:
|
| Back Home Next |
| 1
. Background Research
2 . Data Collection, Preparation, Manipulation 3 . Methodology |
4
. Spatial Analysis
5 . Results & Discussion 6. Problems & Errors |