Data Collection, Preparation, Manipulation

 
Part I:
Data Collection 

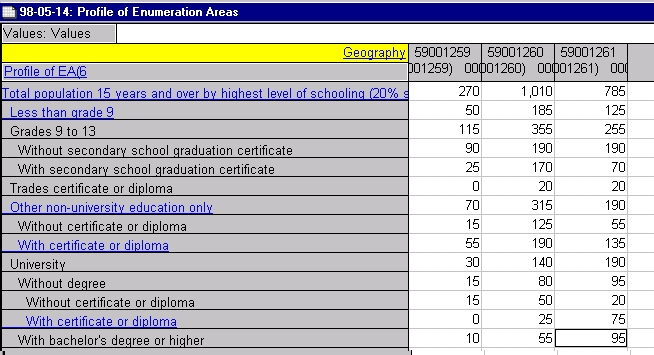
The Data I needed, was data of the mentioned socio-economic factors for the smallest available areas of Vancouver. As the research works with particular categories, I had to pick data from which I could create these categories or at least similar ones. 

The data I needed, offered the Census 1996 with Enumeration Areas as the smalles units. I got the data from the Research Data Library and explored it with the 20/20-Browser (unfortunately, do only two computers offer this browser, which is essentially necessary to explore the data). 

A Map of Vancouver's Enumeration Areas was kept on the Server in 'AV Data'. As it was a shape file, I had to import it from Arc View.


Data Preparation & Manipulation

The Manipulation of the data took by far most of the time of this project. The reasons were not at last the poor possibilities of the Datawork Shop in IDRISI to work with data. 
In the following section, I am trying to outline what I did with my data, how often I had to import and export it and what other problems occured: (I guess this section is totally boring for anybody except Nadine – but it had to be mentioned!)

Getting the data tables
 

  • My Enumeration Area Map of Vancouver had about 850 Areas, each area was given an 8-digit number, the official identifier for Enumeration Areas (EA).

  • Taking the lowest and the highest number and downloading the data for these range of numbers from the Census of Canada, I found out, that there are obviously a lot of areas inbetween my maximum und minimum value, which I am not going to need: I got more than 5500 EAs from the Census.
    The next step would be selecting my 850 areas from the 5500 ones. 
  • Idrisi does not offer a suitable query. Therefore, I had to export my data to Access.

  • The first step was to make  the EA numbers in the 4 tables equal(age+gender, education, employment and the table for the 850 areas), because the Census kept the data with the 8-digit-code and additional information. Thus, I had to export my data to Excel, to extract the first 8 strings of the EA columns of the 3 tables and import it to Access again. Here, I made several queries in order to extract the 850 areas I needed. (Which is not easy at all, if one has never worked with Access before and no manual is kept in the lab (I know Access better now, than I know anything else)).
  • I exported my Access tables to Excel, saved them as a dbf-File (which is the only file, the Database Workshop imports) and imported my tables to Idrisi again. I tried to link them to the map. Although the table of the map kept the EA numbers, it did not want to accept them as linking field. He accepted only the Identifiers of the field, which were provided by Arc View (could be a result of the import of the file from Arc View.)
  • I exported my tables to Excel again, where I mainly had to manually provide the Identification numbers to the related EAs, because the fields kept in each table are not 100% identically (for some reason, the census data misses fields in  some data tables). 

  • I did a few more queries in Access, in order to bring  the identifiers into line. I copied it to Exel again, saved it as dbf and imported it with Idrisi.
    (I mention here only the 'basic imports and exports", I do not talk about the several ones, where Idrisi did not take all information, because the names of columns started with the same word or because of other tiny problems. Apparently, Idrisi is a little bit picky about the data it wants to import.) 


In the end (after days), I had  my datatables in Idrisi and calculated the fields I needed in order to get the same categories as the literature refers to. 


                                               Example 'Education':

My literature refers to the Categories

  • Less than highschool 
  • Highschool
  • Some College
  • College Graduates
The Census data keeps the Categories:


Thus, I built up my categories by addition.
(It was not easy to figure out, what to take for which category, especially if one did not grow up with this school system.)

For all factors, I calculated columns showing the percentages. 

Creating Maps from the datatables
 

  • As the map is still kept as a vector file, I build up vector link files out of my datatables. But Idrisi is not able to convert them to raster.
  • Thus, I converted my basic map to raster and assigned Attribute Value Files, which I exported from the Database Workshop. (Thank god, one of my classmates had spent her weekend to find out about that. I spent futile hours of trying without being able to get any help: the Idrisi help and manuals offer poor information and our Tutor does not know the program).
In the end, I had created raster maps showing the distribution of different socio-economic criteria in the Vancouver region.
For some reason, Idrisi sometimes took the values from the data columns and sometimes built up an own range. Because it is essential for my analysis to have the original values of the columns, I had to find out about the relationship of the original values and Idrisis new values. Then I muliplied the values with the relation factor to get the old values.


Part II: Market Analysis for Dealers 

The data that I need for Part II of my project are 'Number of Drug-users per Enumeration Area' and the locations of the skytrain and police stations. 
The result of Part I provides information about the Number of Drug-users per EA. 
I created the skytrain and police stations by digitizing. I got the locations out of Vancouver Maps and the White Pages. 


Back               Home                 Next

 
 1 .  Background Research
 2 .  Data Collection, Preparation, Manipulation
 3 .  Methodology
 4 .  Spatial Analysis
 5 .  Results & Discussion 
 6.   Problems & Errors