Ecological Footprint
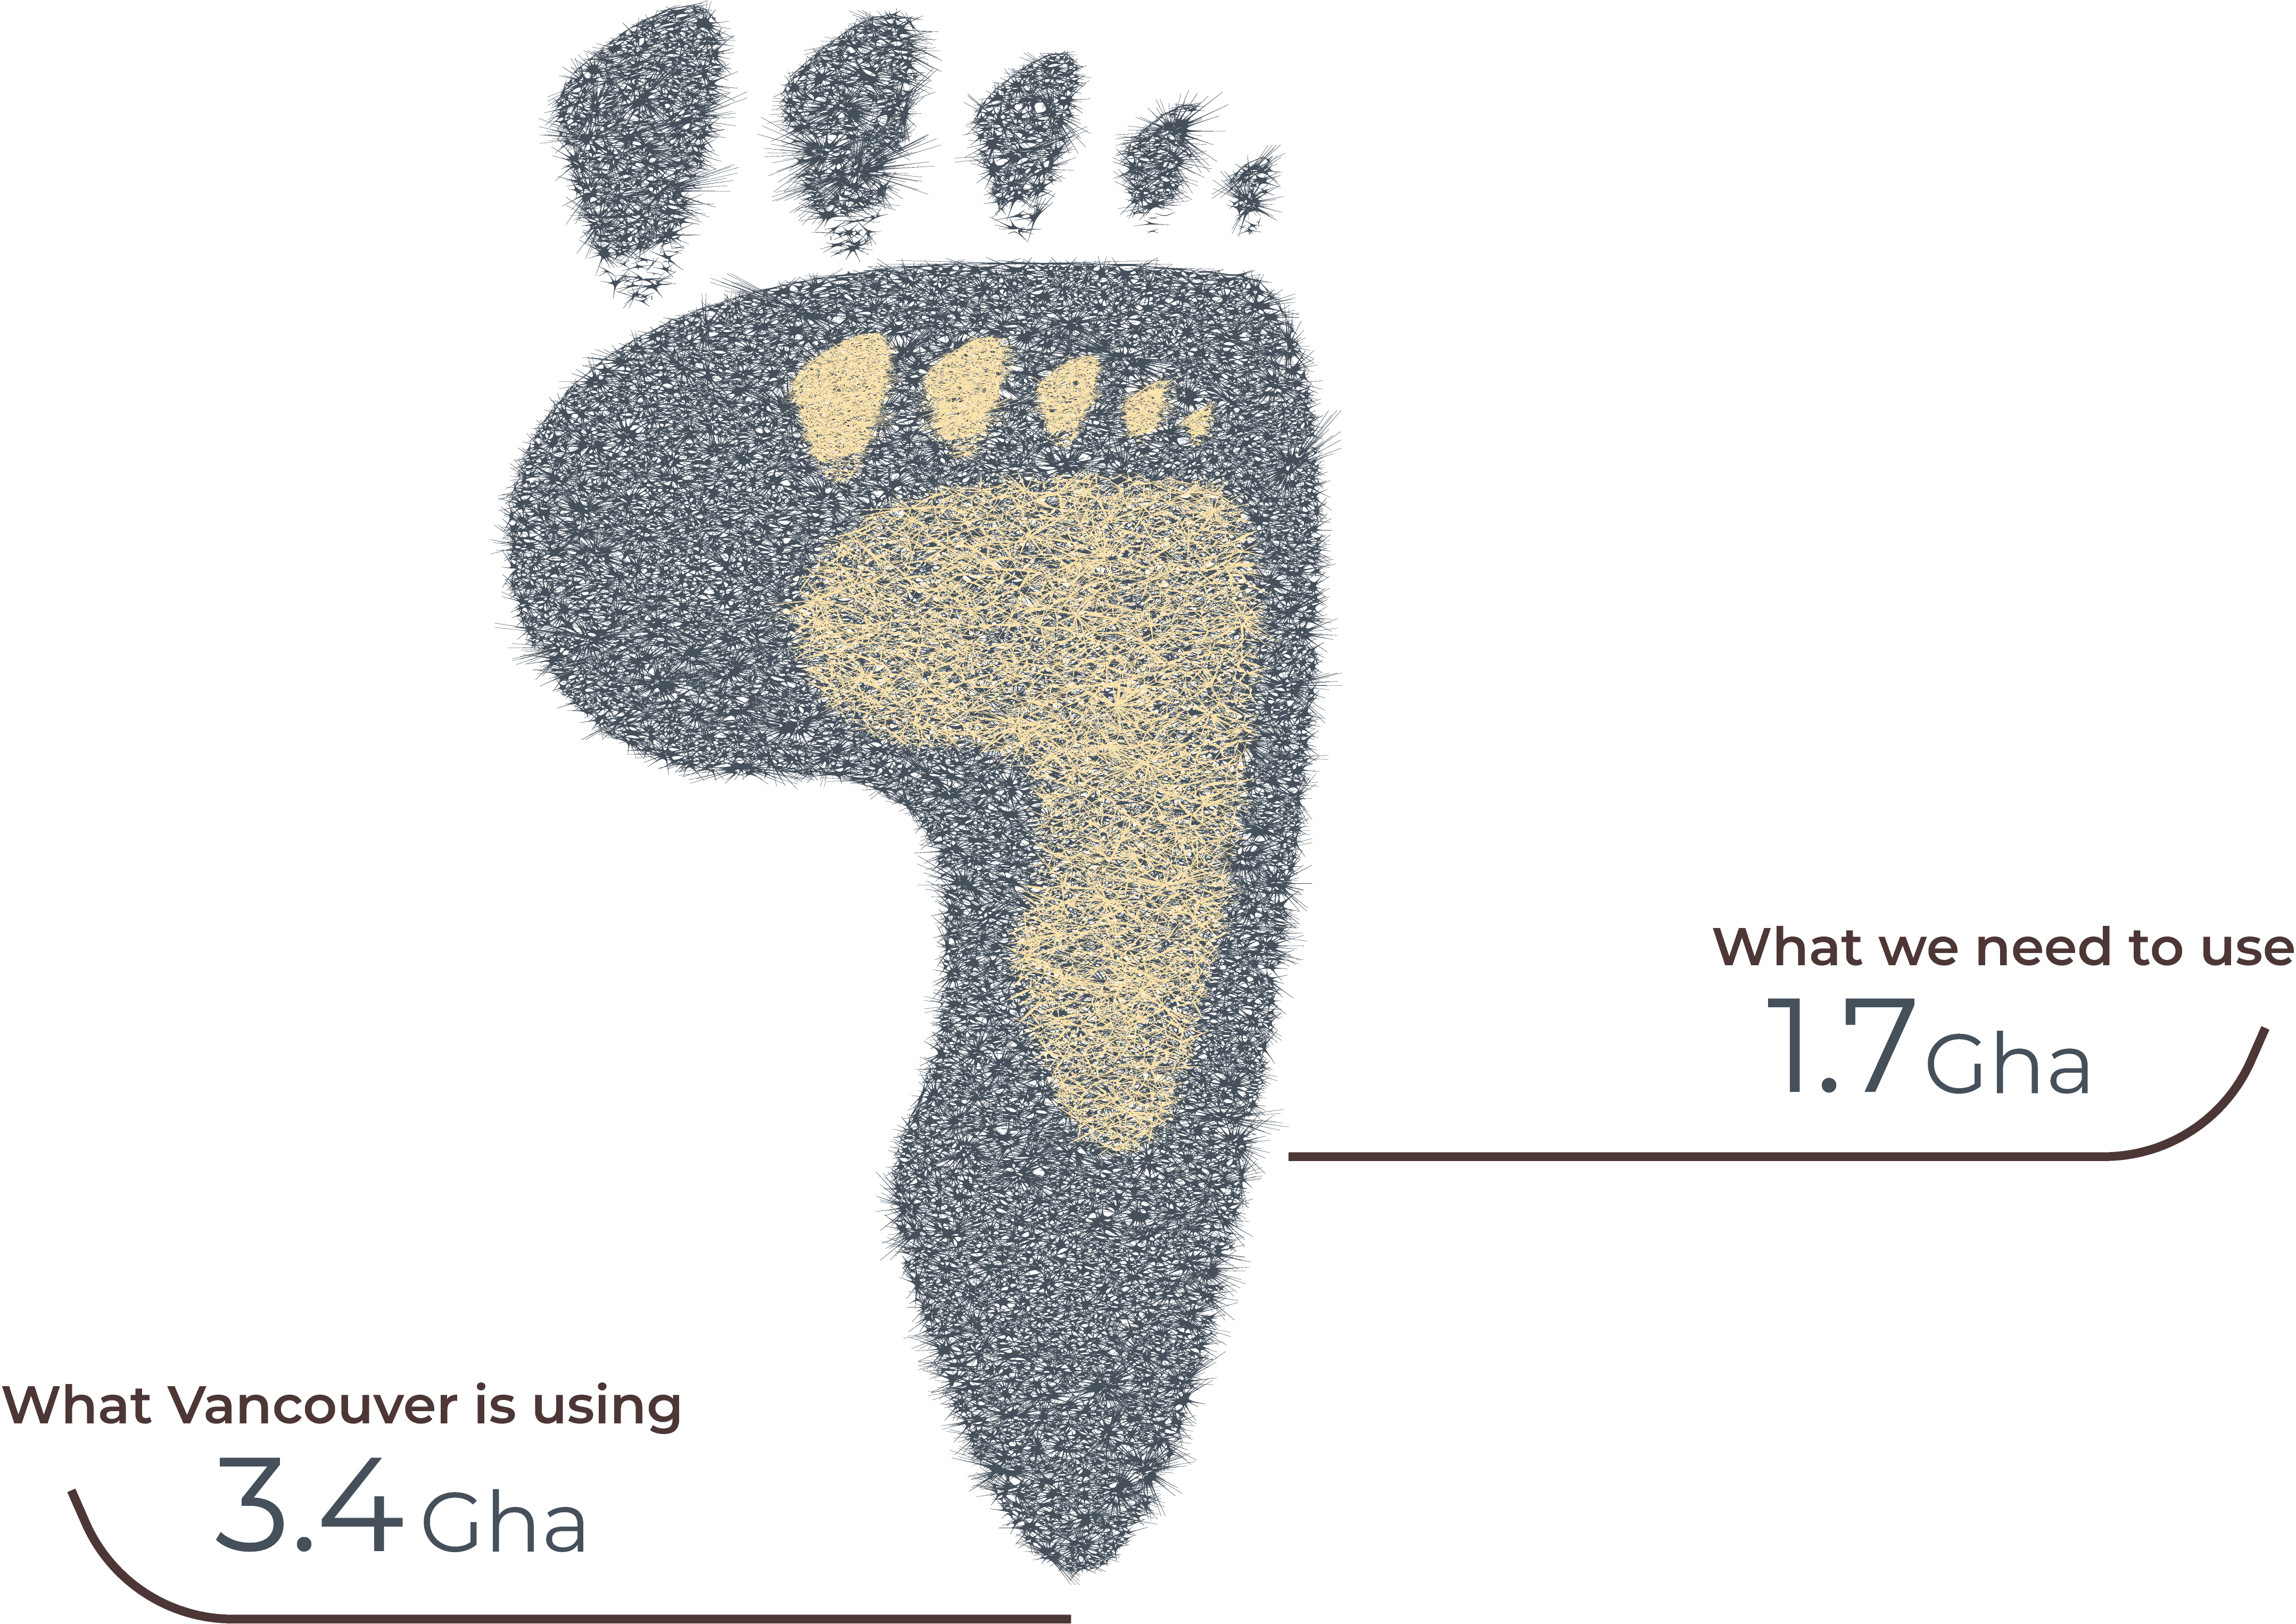
The ecological footprint is measured in global hectares (gha) per capita, where a global hectare is a biologically productive hectare with globally averaged productivity for a given year. It is an estimate of how much biologically productive land
and water area an individual or population needs to produce all the resources it consumes and to absorb the wastes it generates. Based on current global population and biological productivity levels, an average of 1.7 hectares is available for each
person on the planet.
Vancouver’s total ecological footprint is 1,820,000 gha, which is an area 170 times bigger than the City’s municipal boundary. Vancouver’s current per capita footprint is 2.9 gha, excluding the resource demands associated
with national and provincial services such as the military. If we were to add these national and provincial services, Vancouver’s per capita footprint increases by at least 18%, to 3.4 gha/person. Although Vancouver’s footprint is significantly
less than the Canadian and US average, it is still twice what is available.
Put another way, this means that approximately 2.0 Earths would be required to support the global population if everyone had lifestyles comparable to a Vancouver
resident.