All the main objectives
of the project were successfully accomplished, dispite a few somewhat
major problems, and some unanticipated results
with 3D Analyst were achieved. For instance,
it was not known how 3D Analyst would project
features that were only represented by a single
pair of x,y coordinates, but they were displayed
without any problems as "floating" dots in the view.
It was also anticipated that in order to project
all the polygon features in 3D they would have to be
shown as a series of flat transparent layers,
but when they were brought into a 3D view they
were shown as "floating" polygons. Extrusion
of the postholes and pits, using their depth value
(av. z_top minus av. z_bottom), displayed them
as true 3D features.
Another difficulty was that once the fields
for the attribute tables were created they could not be
changed from one type to another(string to numerical). The feature
number field was constructed
as 'strings' because some features were initially labeled 36A, 36B,
etc, which caused the scripts
used to connect the points not to function, as the 'count' function
in the script could only be carried
out on a numerical field. This was solved by re-naming the feature
numbers without characters.
Finding and implementing the scripts to connect
the feature points and create polygons from
them were additional difficulties that had to be dealt with.
Once the scripts were found they often
would encounter things they couldn't process, such as any other view
name but view 1. When the
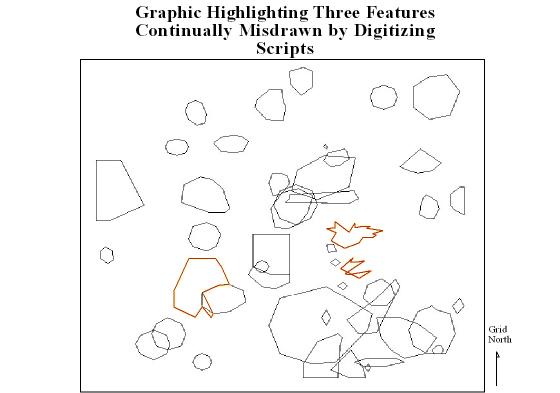
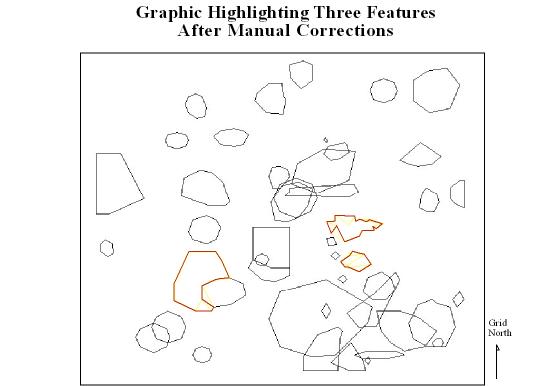
scripts could finally successfully run it was found that they repeatedly
mis-connected the points of
three features, and the only way to correct this was to manually reposition
the vertices to show the
correct shape of the feature (Fig. 1 & 2). Another problem
with the scripts was that when
they generated the polygons they didn't preserve the correct feature
ID's, thus each feature number
had to be manually re-entered in order to join the new table with the
original table, and the data
it contained.
Figure 1

Figure 2

Considerations
There are a few issues
that were not addressed with this project so far. The main one is
that
average z tops and bottoms were used to generate
the features. Future manipulation of the features
should try and see what would happen if the actual
z values were used, would this affect 3D
projections or extrusions? Also, in order
to complete the view in figure 3 the z values of each soil
layer would have to be separated and represented
as different TIN's. This would allow the user to
see the different features in relation to the
different soil layers.
It needs to be kept in
mind that further develoment in the software should be towards making it
more user friendly, such as being more flexible
in dealing with variable survey methods. This is very
important because those who are unfamiliar with
GIS may find the restrictions frustrating and revert
back to traditional, and limited, analysis methods
or call in a 'systems expert' who may not know
about the needs and objectives of a project.
As GIS is becoming more and more utilized by
non-geographical disciplines, more dynamic and
user friendly applications will be needed to deal
with the differing situations and individuals
who would require unique software requirements to suit
particular analytical needs.
Special Thanks to Doug, Ian, Jason and Riley for their contributions towards this project
Introduction/Background/Site/Methodology/Analysis/Discussion/Links/Home