Earthquake Hazard GIS Modelling in the Greater Vancouver Regional District
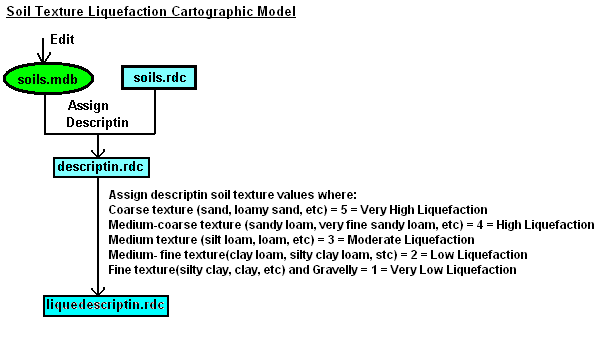
- Soil Texture liquefaction cartographic model
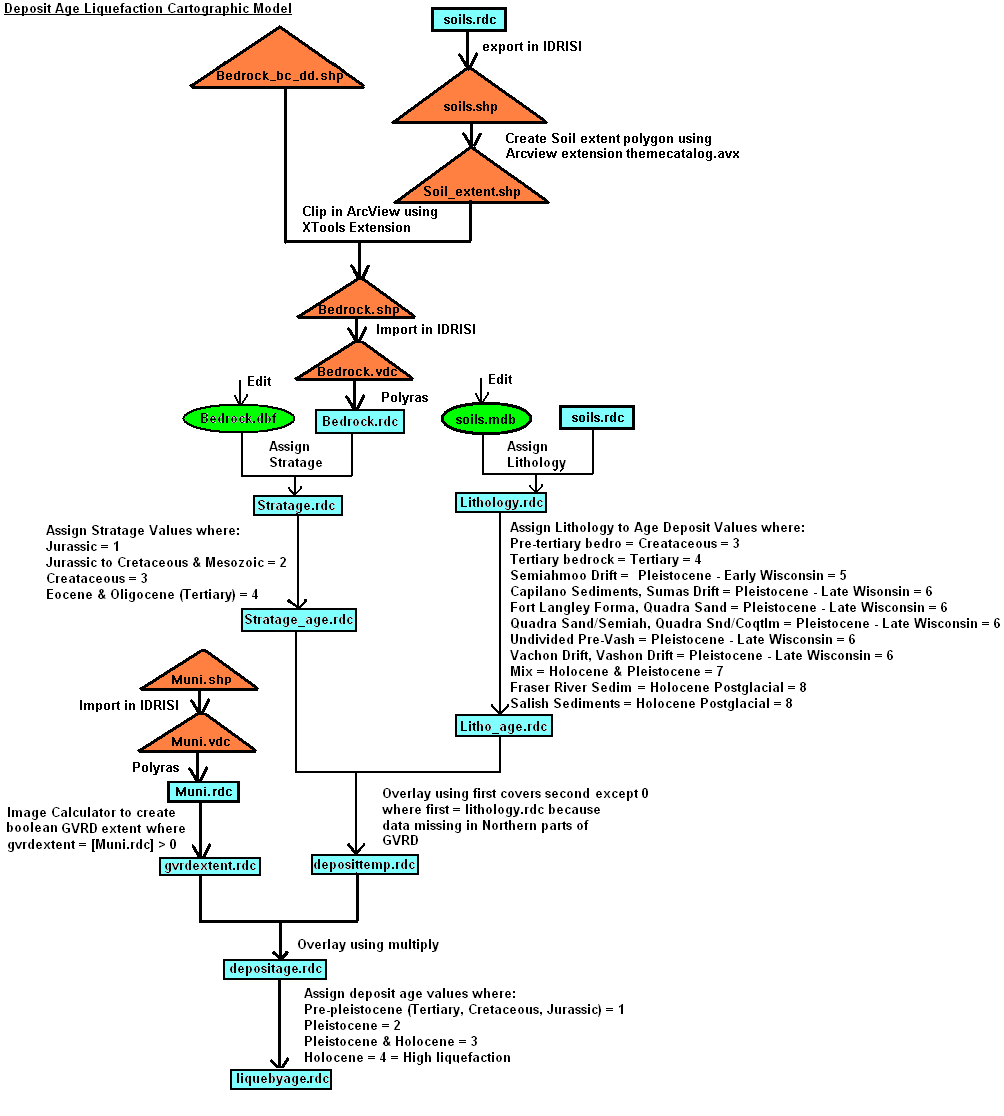
- Age of underlying deposit liquefaction cartographic model
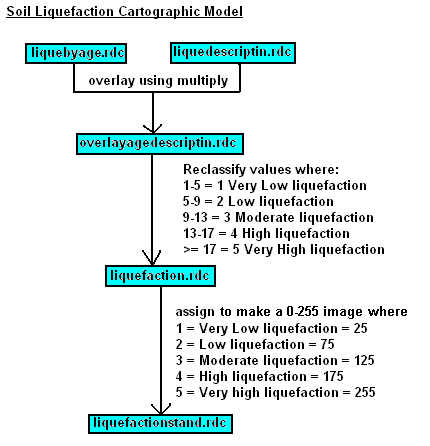
The above two models are then overlayed to produce the final Soil Liquefaction cartographic model as shown below.
Note: You can click on descriptin.rdc and liquedescriptin.rdc to see the corresponding maps. The clicked map will pop up in another window.
 |
Note: You can click on stratage.rdc, lithology.rdc, liquefactionbyage.rdc to see the corresponding maps. The clicked map will pop up in another window.
 |
Note: You can click on liquefactionstand.rdc to see the final map for soil liquefaction. The clicked map will pop up in another window.
 |
NOTE: This web is created on Nov 19, 2002 by Carol Cheuk (Student #: 973003525) for course GEOG355 Project. It is optimized for resolutions of 1024x768 and above and requires the use of Microsoft Internet Explorer or Javascript enable browser for best results.