An example of data preparation
in ArcView. This image was captured after
each of the 25 provincial
forest/government reserve files had been converted to
shapefiles, but before all
the files had been merged into one layer.
In order to prepare my data for analysis, I used both ArcView and Idrisi.
ArcView Data Preparation
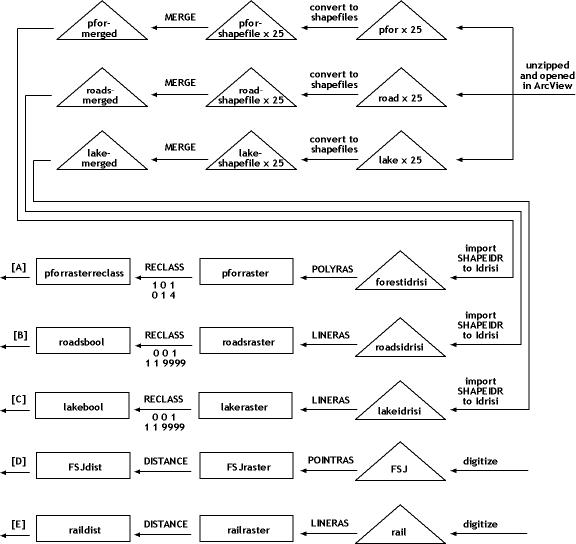
Because I had recieved the data as 25 separately zipped map sheets, each theme for each layer had to be opened one at a time in ArcView. After opening all 25 sheets for a layer, I then converted each into shapefiles. Finally, the shapefiles could be merged using ArcView's geoprocessing extension, resulting in one shapefile for each of the layers Roads, Rivers and Lakes, and Provincial Park/Government Reserve. It was a very time-consuming process.
An example of data preparation
in ArcView. This image was captured after
each of the 25 provincial
forest/government reserve files had been converted to
shapefiles, but before all
the files had been merged into one layer.
This was essentially the extent of my data preparation in ArcView, with one exception. I found the Rivers and Lakes layer to have excessive detail, which was to be expected with 1:20k data. As the data table showed no ranking of river or lake size, it was quicker for me to start editing, select, and delete the unwanted water bodies by hand. I did this while referring to an NTS mapsheet so that I knew which size of water bodies to keep or delete. I considered doing this for the roads layer, but it was just too difficult without having the roads classified properly.
Before deleting excess
water features.
After deleting excess water
features.
My three vector layers (Roads, Water, and Park/Reserve) were then ready to import into Idrisi.
Provincial Forest/Government
Reserve Layer
Roads Layer
Idrisi Data Preparation
I imported the Roads, Rivers and Lakes, and Provincial Forest/Government Reserve layers into Idrisi using the software-specific SHAPEIDR command. I rasterized each of the layers using LINERAS and POLYRAS to prepare for analysis.
Notice the problem with using
such detailed data at a smaller scale. The roads and rivers are all
there, you just have to
zoom in to see them.
Additionally, RECLASS was used on all three layers in order to allow boolean operations. Here is an example:
Finally, after these three layers had all been rasterized and reclassed, I had to digitize the BC Rail line. The rail line was also rasterized; it did not need to be reclassed because I classified it properly while digitizing. I also digitized the proposed OSB plant and the Fort St. John airport, not for analysis, but for clarity on the maps. Digitization was completed with the aid of NTS map sheets at 1:50k and 1:500k. A special thank-you to Michelle for lending me an on-screen drawing implement.
This map shows the rail,
OSB plant, and airport that I digitized. They are shown here in
vector form and at larger
scale for clarity; the rail line was rasterized for analysis.
With importation, digitization,
rasterization, and reclassification completed, the data was now ready for
analysis.
Cartographic Model:

|
| BACK |
1.
Spatial
Question
2.
Data
Collection
3.
Methodology
4.
Spatial
Analysis
5.
Methodological
and Operational Problems