


Data used for this study includes:
- 2001 Canadian Census
- 2001 GVRD land-use dataset
- DMTI Multiple Enhanced Postal Codes dataset
- Discharge Abstract Database (DAD)
In order to measure social gradients in health research it is common to use a deprivation index. To determine SES, this analysis used the Vancouver Area Neighborhood Deprivation Index (VANDIX), which was developed by Bell et al. (2007). To calculate the VANDIX seven socio-economic fields from the 2001 Canada Census data were chosen such as: including average income, home ownership, single parent families, number of people with no high school completion, number of people with a university degree, employment ratio, and unemployment rate. Each of theses fields were assigned a weight.
Table 1 - List of weights used for each census component in the VANDIX
| Average Income | 0.089 |
| Home Ownership | 0.089 |
| Single Parent Families | 0.143 |
| No High School Degree | 0.250 |
| People with University Degree | 0.179 |
| Employment Ratio | 0.036 |
| Unemployment Rate | 0.214 |
A total weight for each DA was then calculated. In order to standardize z-scores were calculated for each DA. This dataset was joined with the DA spatial file using are ArcView. The data was divided into five quintiles. (Click on Images to Enlarge)
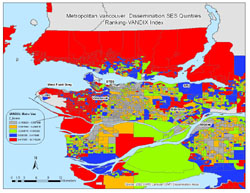
Figure 1 – VANDIX for all areas in Metropolitan Vancouver
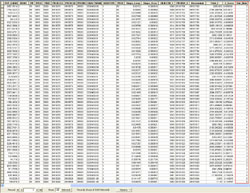
In ArcMap, the SQL querying tool was used to assign quintile numbers to each DA, with “1” being the least deprived and “5” being the most deprived see red outlined field in the table below.
Table 2 – Quarried Dataset Including Quintile Numbers
The DAD contained postal code information of burn victims in BC from 2002 to 2006. Using the geo-coding tool in ArcMap and the DMTI Multiple Enhanced Postal Codes file, the location of burn victims were plotted on a map.

Figure 2 – Spatial distribution of burn injuries across Metropolitan Vancouver
This data was clipped to the Metropolitan Vancouver residential areas. Some postal codes fell on roads and were not in the residential areas; hence a tolerance of 0.04 km was used to insure that they would be geo-coded in a residential area. Burn injuries that were within Metropolitan Vancouver but not within the residential areas were excluded this can bee seen circled in red on the above map.
In order to analyze burns injury locations and SES, a point in polygon analysis was carried out. Using the intersect tool in ArcMap the burn victim location and the deprivation indices were combined to one large dataset (see map below).
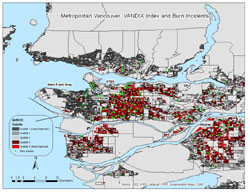
Figure 3 – VANDIX and burn injuries across Metropolitan Vancouver
Once the two datasets were combined, the summary statistics tool was used to obtain the results.
Table 3 – Summery of burn injury analysis
| Quintile | Number of Cases | Percent of Cases | Number of Males | Number of Females | Mortality | 1 | 38 | 15.3 | 26 | 12 | 1 |
| 2 | 52 | 21.0 | 40 | 12 | 2 |
| 3 | 28 | 11.3 | 18 | 10 | 2 |
| 4 | 55 | 22.2 | 40 | 15 | 2 |
| 5 | 75 | 30.2 | 49 | 26 | 7 |