DATA ACQUISITION
The data used for this analysis was collected mainly from the SIS Drive Data Warehouse located at Simon Fraser University's GIS Lab. The maps acquired from this drive were:
municipalities.shp - Converted to an IDRISI raster file and used as the background for all results maps used on this website. This is a map of the GVRD (Metro Vancouver).
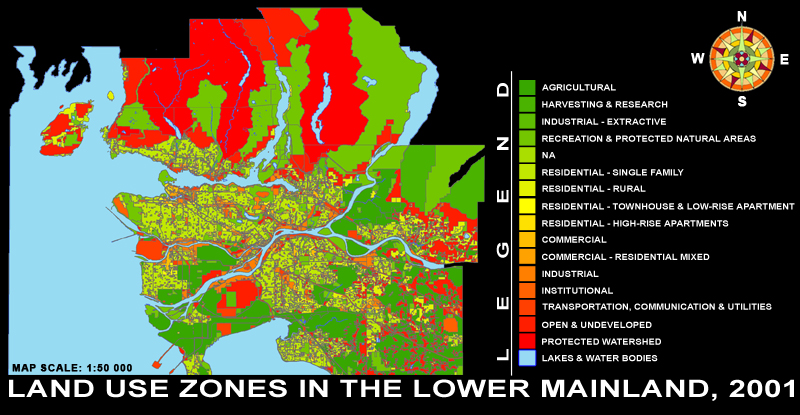
gvrd_lu_2001.rst - This file was used extensively in the multi-criteria evaluation and also in the boolean evaluation. It is a detailed map of land use in the GVRD for 2001.
gvrd_lu_1996.rst - This file was used solely for the comparison map in the Introduction to this website.
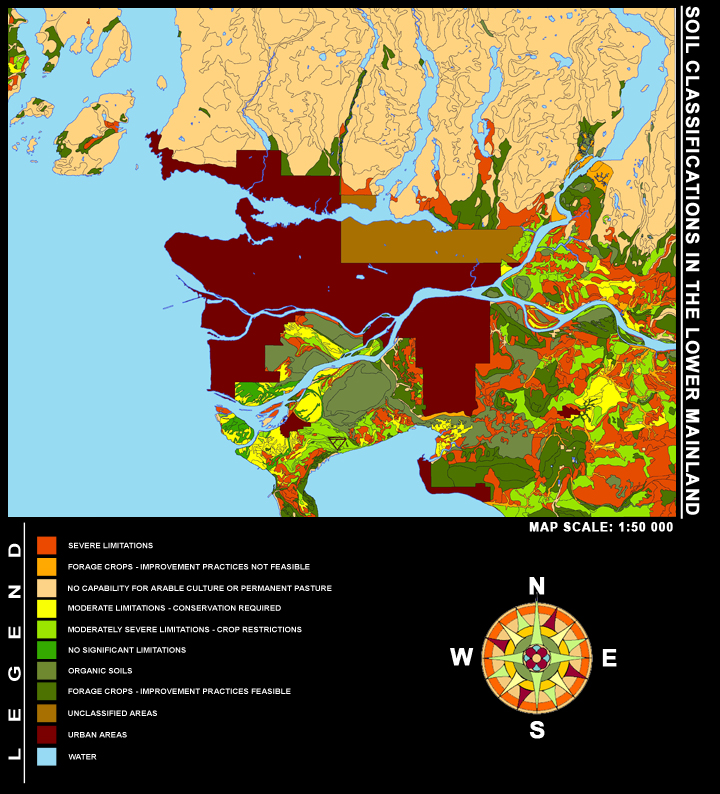
vanbcagri.shp (vanbcagri_tic, vanbcagri_arc, vanbcagri_polygon, vanbcagri_label) - The only file not from the Data Warehouse, this file is a detailed terrain map of soils found in the Lower Mainland. It was integral to the analysis performed on this website, and it can be found here.
Note: gvrd_lu_2001.rst and vanbcagri.shp were the base maps used for all analyses performed on this site. They can be viewed unedited below.
PROGRAMS USED
Several programs made this analysis and subsequent website possible. They were:
ArcGIS - Used for some analysis, shape file conversions and for minor graphic design.
IDRISI Andes - Used for most analysis, including boolean operations and multi-criteria evaluations.
Adobe Photoshop CS - Used for map editing and the addition of graphic elements. Please note that no maps were altered to skew results, map editing was strictly limited to scaling and the addition of map elements.
Adobe Dreamweaver CS3 - Used to create the website.
METHODS USED
Two distinct methods were used in this analysis. Both relied on the same criteria to produce their results. The criteria used was as follows:
1. Soils must fall into the following categories to be suitable for agriculture: moderate limitations, no significant limitations, organic soils, or improvement feasible. Suitable soils are shown here.
2. Current land use must accomodate agricultural practices. Land use designations which are suitable are: open and undeveloped, and residential - rural. Suitable agricultural zones are shown here.
3. Water must be at leat 5km away to support irrigation and runoff.
4. Residential areas must be further than 1km away to avoid noise and smell complaints. Residential areas are shown here.
5. Commercial areas must be within 2km to avoid transport costs to local merchants. Commercial areas are shown here.
6. Slope must be below 15% to avoid soil erosion and excess irrigation runoff. A slope reclass map is shown here.
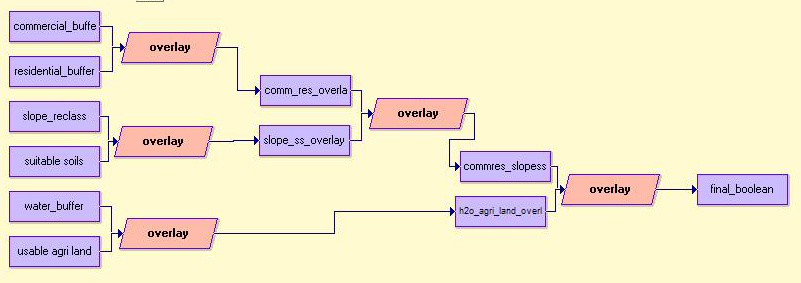
BOOLEAN METHOD
The first method used was a boolean operation using macro modeler. This operation revealed the areas of the lower mainland that were 100% suitable for agricultural practices. This was achieved using the BUFFER function and the OVERLAY multiply function. Below are some of the macro models used to achieve this operation. The final output map can be viewed in the results section.
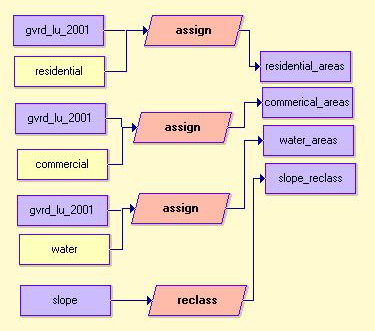
Buffers were applied to residential, commercial and water zones between above macro and below macro.
MULTI-CRITERIA EVALUATION METHOD
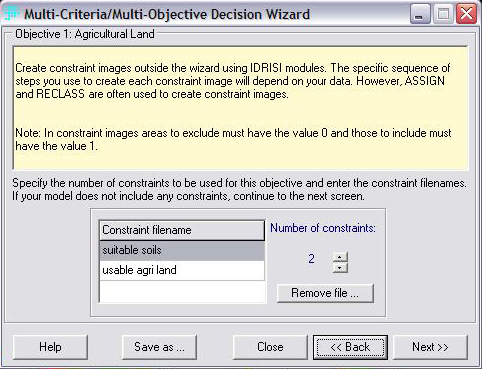
Because the above boolean method only shows areas with 100% suitability, it is not as useful as an MCE. An MCE, using the Display Wizard in IDRISI Andes, calculates the suitability on a scale from unsuitable to excellent suitability. This scale is determined by the user and is controlled by factors and constraints. Constraints are criteria that are true for all MCE elements. They constrain the evaluation to within their limits. Suitable soils, and usable agricultural land are the constraint files used in this MCE:
Factors are those files which either improve or degrade with distance from your area of study. For this analysis four factors were used:
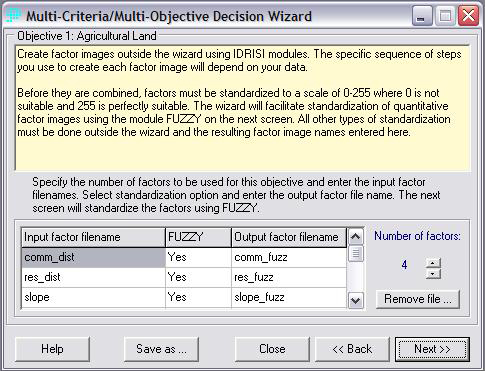
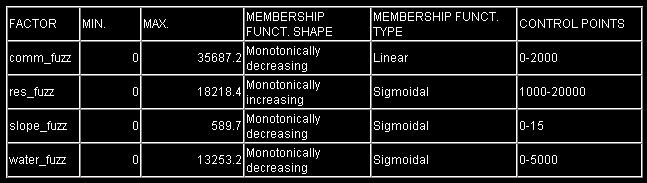
It is important to note that prior to running the MCE, factors underwent a DISTANCE operation to calculate distance from selected zones. Each factor also underwent a standardization procedure known as FUZZY, which converts qualitative factor images into a 0-255 scale. The files comm_fuzz, res_fuzz, slope_fuzz and water_fuzz were thus created. Below is a table of the MCE elements:
The final output map for the MCE can be viewed in the results section.