


DATA
SPATIAL ANALYSIS ON THE BEST LOCATION FOR A NEW RETIREMENT HOME IN THE GVRD |
||||||||
|
DATA ACQUISITION
The data used in this project are mainly from two sources; the SIS S: drive, and data that was created specifically for this analysis
Main GVRD Bus Routes: Obtained from the SIS S: drive
GVRD Municipalities: Obtained from the SIS S: drive
Sky Train Stations: Obtained from the SIS S: drive using 2003 data
Main GVRD Hospitals: Was created using data from the yellow pages
GVRD Libraries: Was created using data from google maps
Current Retirement Homes in the GVRD: Was created using data from the yellow pages and google maps
Golf Courses: Obtained from the SIS S: drive
BC Highways: Obtained from the SIS S: drive
GVRD Landuse: Obtained from the SIS S: drive using 2001 data
Greenspace, Greenspace2: Both were obtained from the SIS S: drive
GVRD Parks: Obtained from the SIS S: drive
Railways: Obtained from the SIS S: drive
Census Data: Obtained from the SIS S: drive, using 2001 data
Dissemination Areas: Obtained from the SIS S: drive, using 2001 data
DATA PREPARATION
Alot of the data had to go through ArcMap before it could be used in Idrisi. GVRD Bus Routes, GVRD Municipalities, Sky Train Stations, Greenspace, Greenspace2, and GVRD Parks were all shapefiles that required the following manipulation:
- Imported into ArcMap
- Projected from their origional format to utm-10n
- Exported from Arcmap
- Imported into IDRISI (converted from a shapefile into an IDRISI vector format)
- Data were rasterized using LineRas and PointRas
GVRD Landuse, Golf Courses, Railways and BC Highways were all in raster format ready for use in IDRISI. Some of the files had to be changed to utm-10n.
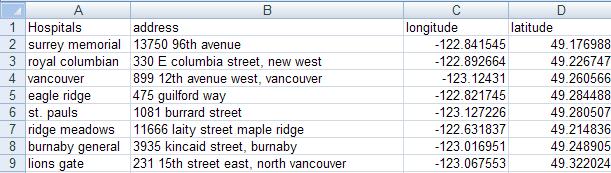
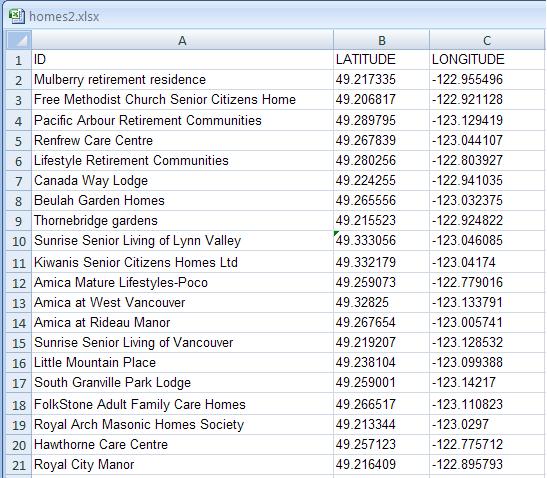
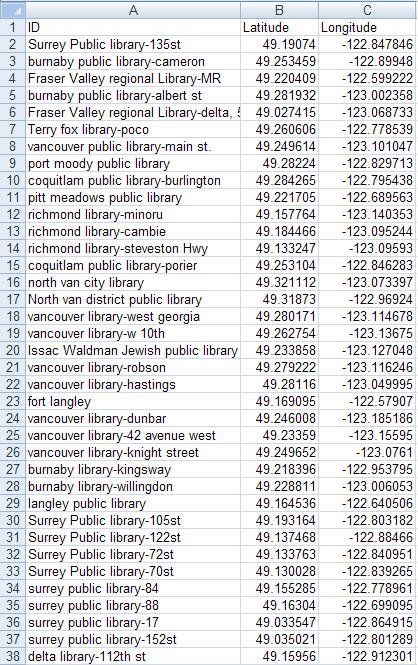
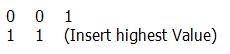
Main GVRD Hospitals, GVRD Libraries and Current Retirement Homes in the GVRD were all data created specifically for the project. This was done by collecting the place name and address, then pluggin the address into geocoder.ca to acquire the latitude and longitude. The place name (ID) and latitude and longitude information was recorded in Microsoft Excel under three columns (see images below)
Next,
-Using ArcMap, the data tables were added using tools, add X,Y data function
-The data was projected into utm-10n
-The data was exported from ArcMap
-The data was imported into IDRISI
-The IDRISI vector point files were rasterized using PointRas
The Census Data was manipulated in the following way:
- The census data (in dbf format) was imported into ArcMap
- The Dissemination Area vector file was added and projected into utm-10n
- The Census data and the shapefile were then joined using the built-in ArcMap join function
- The resulting file was exported
- The census vector link file was Imported into IDRISI and converted from a shapefile into a an IDRISI vector file
- Using database workshop, a raster layer was created for each of the following attribute data:
Males 50_54
Males 55_59
Males 60_64
Males 65_69
Males 70_74
Males 75_79
Males 80_85
Males 85+
Females 50_54
Females 55_59
Females 60_64
Females 65_69
Females 70_74
Females 75_79
Females 80_85
Females 85+
From this point, much of the data required reclassification. The following data were reclassed into boolean images using the following rcl
RCL
-Main GVRD Bus Routes
-GVRD Municipalities
-Sky Train Stations
-Main GVRD Hospitals
-GVRD Libraries
-Current Retirement Homes in the GVRD
-Golf Courses
-BC Highways
-Greenspace
-Greenspace2
-GVRD Parks
-Railways
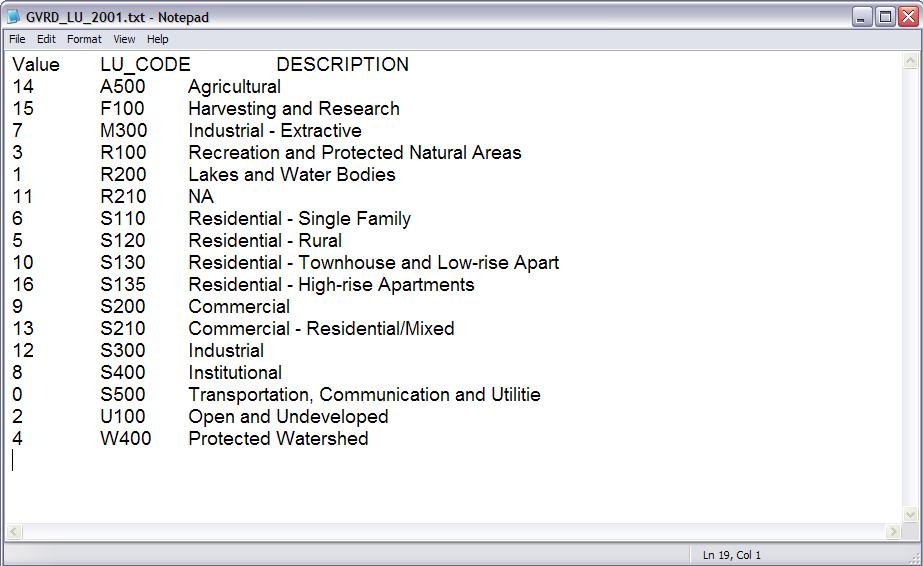
The GVRD Landuse file was reclassified to assign Lakes(1), Protected Watersheds(4), Industrial Areas(7) and Transportation and Utilities(0) all a value of zero. This is because these landuses are all unsuitable for a retirement home to be located. The reclassification was based on the following data:
All of the Census Data layers (16 in total) were reclassified based on where the most people of a certain age were living. For example, the Males 85+ population varied between 0 and 80 in different dissemination areas, but the average was approximately 5. So the layer was reclassed into a boolean image where only areas with an above average number of males above the age of 85 were given a value, and all other areas were assigned the value of zero.
| ©2008 Christine Vance | Geography 355 Final Project |