In
the event of an emergency, the information that propels our
actions can have a dramatic impact on the situation.  The GIS interface depicting the GVRD catchment areas has to
consider a number of intelligent structures in order to best
utilize the services available. What better place to start
than asking what the procedures are for defining a catchment
area?
Health
Care Facility Catchment Areas are understood as a delicate
balance of geographical and demographic information. They
take into consideration the physical world - that of roads,
rivers, lakes, mountains as well as those areas belonging
to the human world - such as populations and municipalities.
Though they help establish where hospitals are constructed,
they are at a disadvantage because unlike the populations
they reflect, they tend to be static geographic boundaries.
During
the course of this project, an underlying theme was recognized.
That is, how do we address questions pertaining to service
zones? The GVRD is particularly interesting in its demographics
and remains a challenge to map intelligently. Due to a lack
of immediate information during the time of project construction,
the following considerations were developed by the researcher:
- What
are the sizes of each hospital - the number of beds, staff
and nursing support?
- What
are the 'traditional' hospitals and which are simply 'extended
care' facilities?
- Are
all of the facilities still open door - are there any health
care facilities that have been shut down?
- What
is the total number of physician offices (surgical/non-surgical)
within the Catchment area?
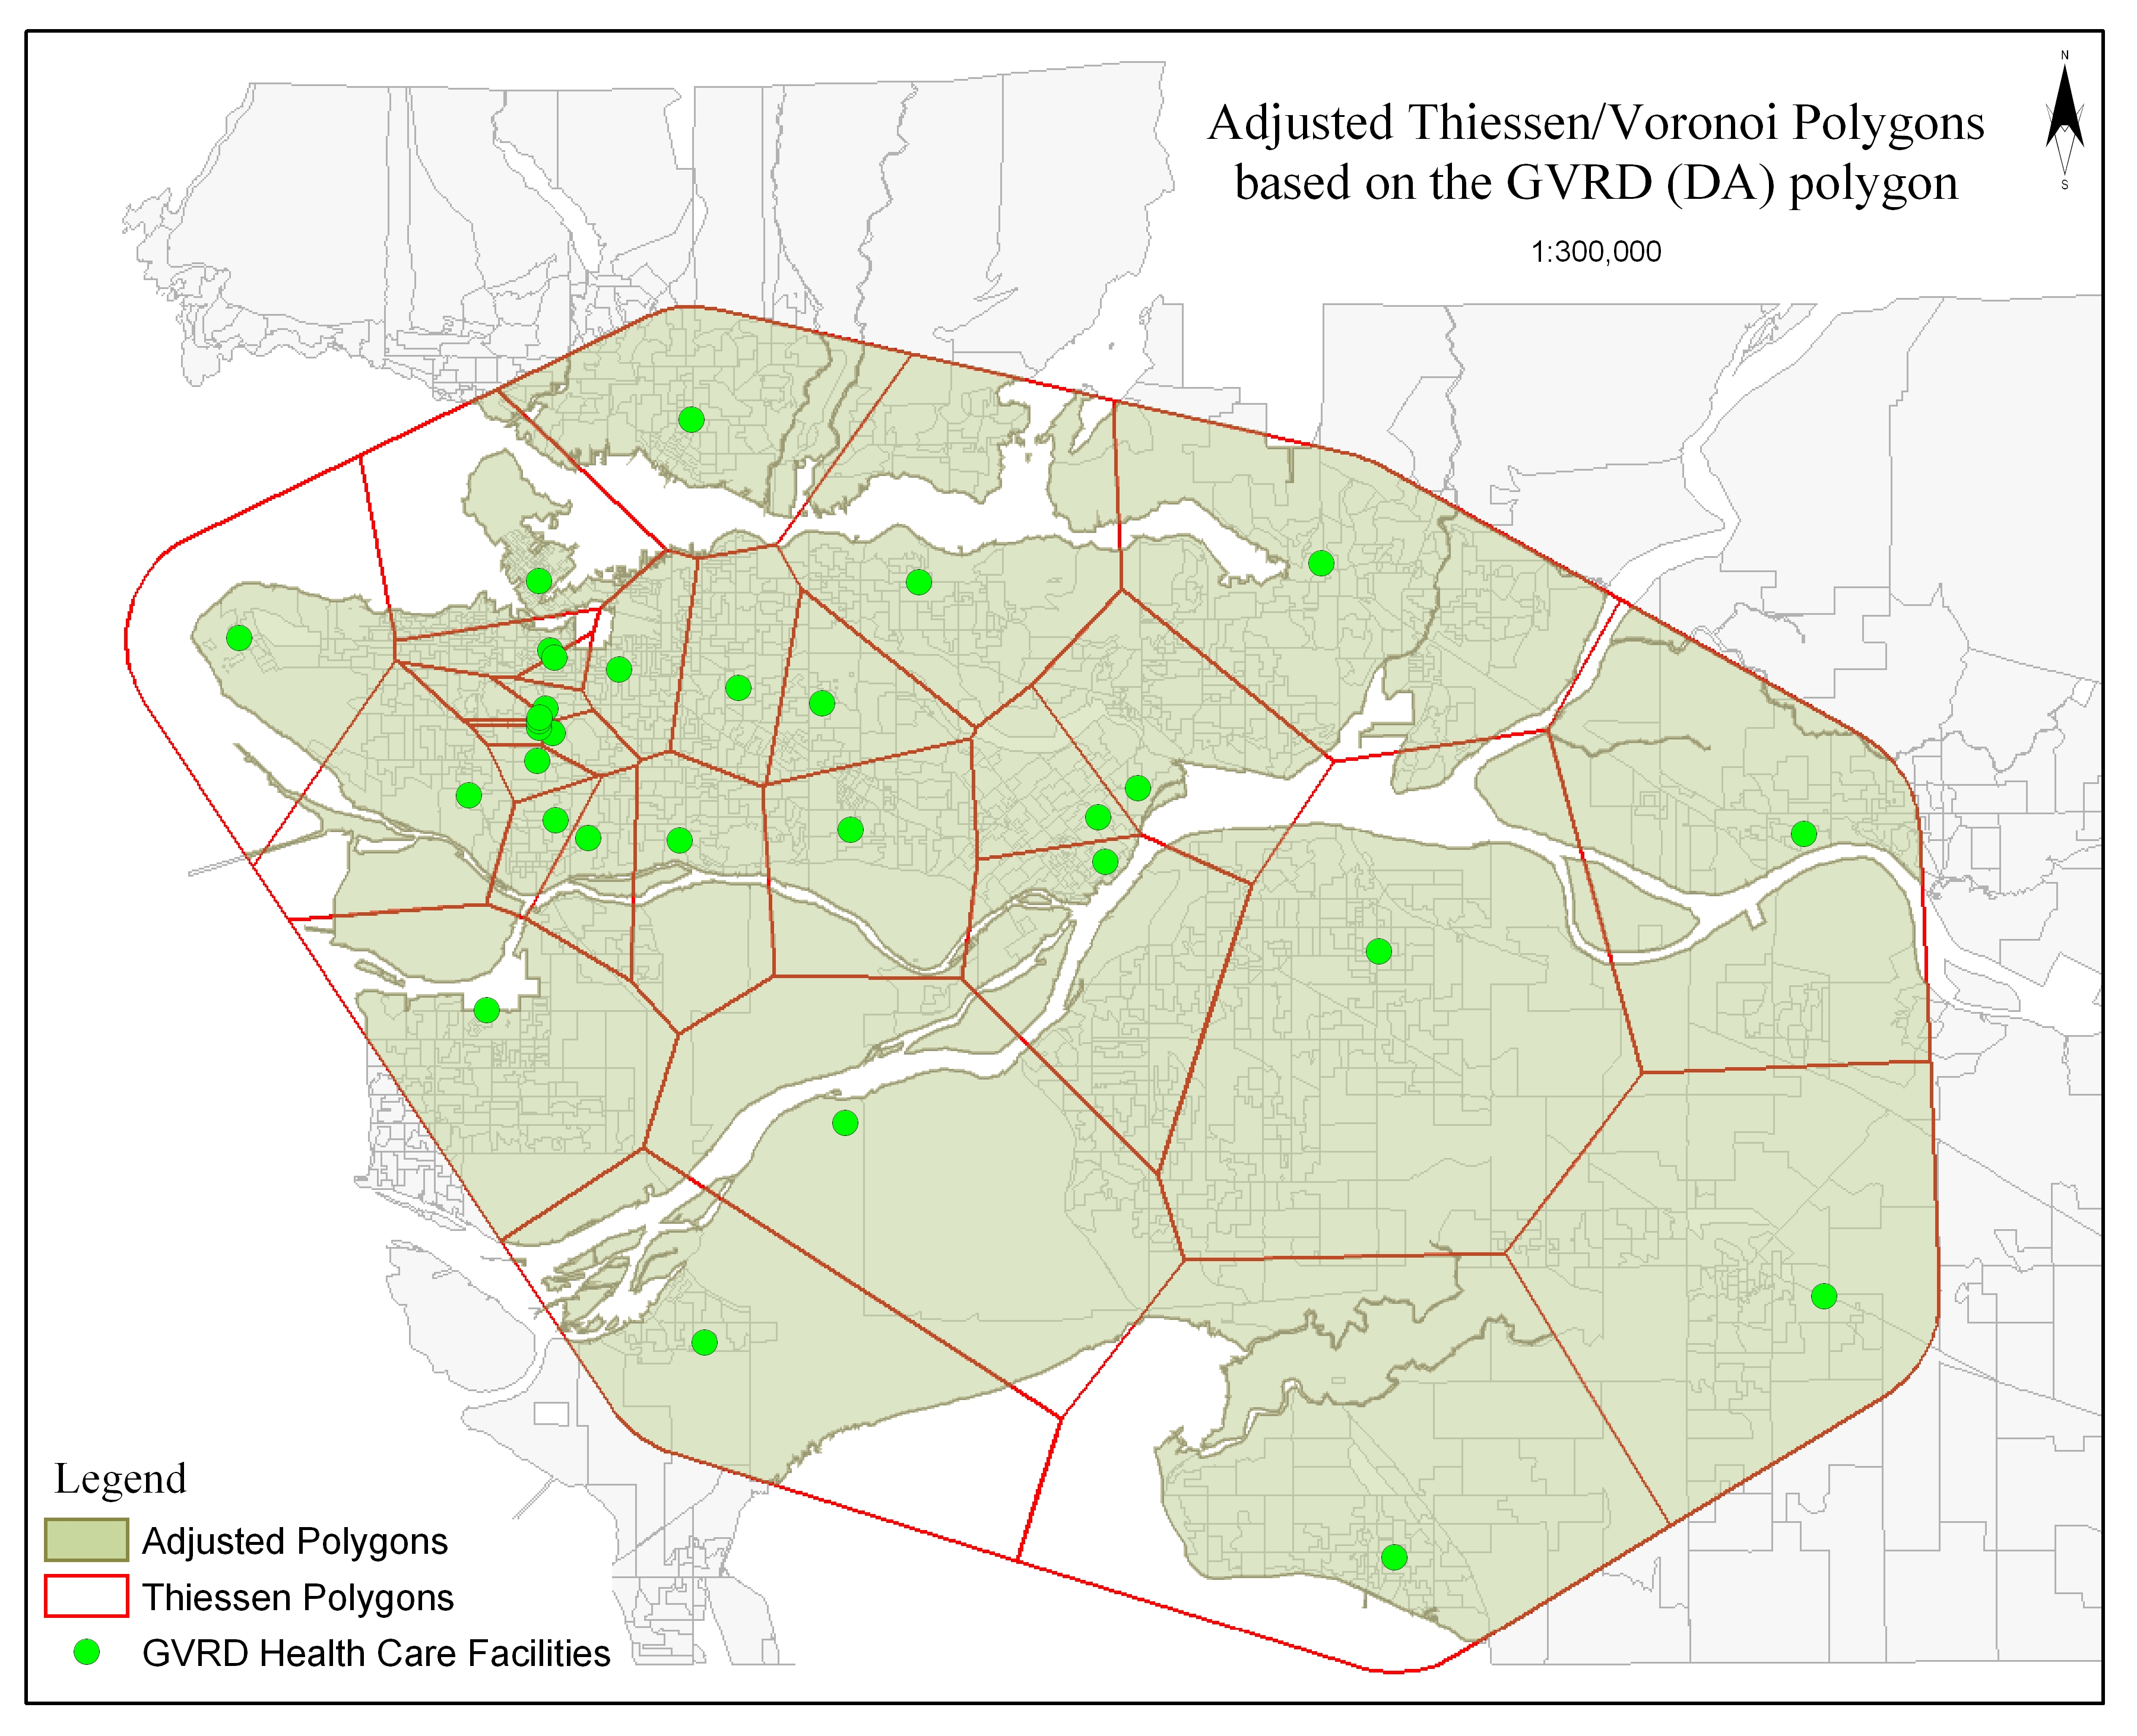
In order to properly weigh the variables to create a catchment
area, the above pieces of information need to be considered.
Due to a lack of immediate and appropriate information, this
mapping project only calculated geographical boundaries during
the creation of the catchment zones (through Thiessen/Voronoi
polygon creation). However, it should be noted that the framework
for this mapping project could be adjusted to show more precise
catchment areas and their interior influences as more information
becomes available.
The process that goes into catchment development are indeed
complex. This mapping project simplified hours of project
planning by knowledgeable professionals and assumed only geographical
weights. However, this was not without its dilemmas. Of foremost
importance is knowing the geographic regions that are being
mapped through the tessellation process. It was noticed that
during the weighted Voronoi calculation, catchment areas that
bordered water were often times separated into more than one
polygon. This was assumed reasonable for areas in local inlets
and rivers containing islands, but was presumed unreasonable
if a section of the catchment zone was calculated on the opposite
bank of the water body. During the planning phase, these pitfalls
need to be recognized as it makes little 'immediate' sense
to send a potential victim across more land mass than necessary
during an emergency. Below are listed two sample images for
further emphasis relating toS this problem.
unweighted GVRD catchments: land weighted catchments:
For
additional information pertaining to mapping population clusters
click here. |
 The GIS interface depicting the GVRD catchment areas has to
consider a number of intelligent structures in order to best
utilize the services available. What better place to start
than asking what the procedures are for defining a catchment
area?
