Methodology
I was faced with many problems during the initial stages of the conversion of my dataset. Although with persistence I was eventually able to convert everything to a format I could manipulate using IDRISI for my final analysis. This process was done using the following programs:


OpenOffice is an open source program similiar to the Microsoft Office suite. I chose to use it for personal reasons, although it is completely compatible with all microsoft based file-types. Primarily, OpenOffice Calc was used for my data conversions from XLS to CSV file format.
In order to allow ArcMAP to geocode my dataset, I had to convert my XLS files to CSV. This was a simple export process, however, there was a certain degree of formatting that needed to happen to allow ArcMAP to properly geocode my data. First, I added the column CITY which contained "Vancouver" as a field value for all addresses. Within the HUNDRED_BLOCK column I changed the addresses to contain whole numbers, as they were listed as "12XX", for example. The replacement was "XX" to "55" to allow the address locater to represent the addresses as a half way point on the block. I also removed the value "Block" from all address entries. Finally, I had to create a filter to show me only one type of crime. As there were seven select crimes listed under the column TYPE. The filter I ran was for "Theft From Auto Under $5000", which I considered petty auto-crime, for use in my spatial analysis.
- This link provides a visual representation of my progress.
Similar formatting was required for my Canada Census data, as I only required the total populations within each neighbourhood in Vancouver. The census data contains a lot more information than that. So from my XLS files, which I converted to CSV, I selected only the neighbourhoods and their total populations. I created a new CSV with only this data listed in rows rather than columns, and provided each row and thus each neighbourhood with a specific number, of which later I would use to join with my neighbourhood SHP file.
- This link provides a visual representation of my progress.
At this point I was ready to begin manipulating my data with ArcMAP.
The bulk of my conversions were done using ArcMAP, a component of the ArcGIS suite. With this program I was able to convert my entire data set into a form with which I could use IDRISI to properly import my data as rasters.
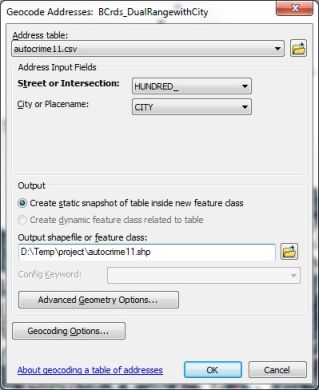
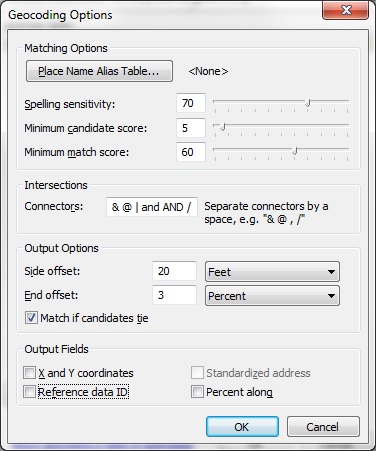
First of all, with ArcMAP I had to geocode my new auto-crime CSVs. This created a SHP file with which I now had a visual interpretation of my crime data. The image to the right shows the options I selected. In addition I had to change both the Advanced Geometry Options and the Geocoding Options, as shown in the two images below. Within the Advanced Options, I changed the Spatial Reference Properties to match those of the neighbourhood SHP files I would later be using (NAD83 UTM Z10). The Geocoding Options are a manditory component to select for the best fit matches when using my selected address locator. |
 |
 |  |
After running "Geocode Addresses" six times, once for each autocrime CSV, I was given the following results for my matches:
| CSV Year | Matched % | Tied % | Unmatched % |
|---|---|---|---|
| 2006 | 93 | 5 | 2 |
| 2007 | 93 | 5 | 2 |
| 2008 | 93 | 5 | 2 |
| 2009 | 93 | 4 | 2 |
| 2010 | 93 | 5 | 2 |
| 2011 | 93 | 5 | 1 |
I now had a set of SHP files that contained auto-crime data for the years 2006-2011, each with a specific point within Vancouver that had been geocoded by address. With such a high match percentage, I was confident with the accuracy of the locations of these crimes. The next step was to use the ArcToolbox to convert these SHP files to a format that could be easily imported into IDRISI.
- This link provides a visual representation of my progress.
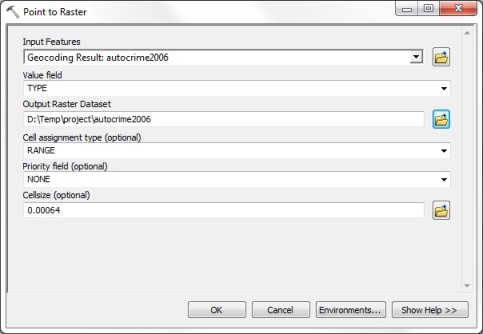
Within the ArcToolbox I used the conversion tool "Point to Raster", creating a set of GDB files, with the following options selected:
 |
I then used the conversion tool "Raster to ASCII", creating a set of TXT files for importing into IDRISI. Previous attempts to create other file formats failed to properly import into IDRISI, ASCII provided the smoothest transition.
The next step was to create a similar file format with the SHP file on rapid transit stations. This was done simply by first converting the SHP to GDB with the "Point to Raster" tool, and again using the "Raster to ASCII" tool for the conversion from GDB to TXT, from which point I could easily import to IDRISI.
I felt as though my rasterized crime data and transit stations required a visual reference, for this I used a SHP file which contained the neighbourhoods of Vancouver. This SHP file was then joined with both my census 2006 and census 2011, which after exporting created two new SHP files, each containing both the polygons of the Vancouver neighbourhoods, and the specific populations for each neighbourhood. It was important at this point to confirm that the values given for each polygon in the SHP file matched those of the values I gave to the neighbourhoods in my population census CSVs. Again, for importing these two SHP files into IDRISI, I used first the conversion tool "Polygon to Raster" and then "Raster to ASCII".
- This link provides a visual representation of my progress.
At this point I was ready to begin importing and manipulating my data with IDRISI
IDRISI was used when all of my data was converted to a format that could be easily imported. The ASCII files created with ArcMAP were imported for rasterization for use in my spatial analysis.
First, I imported the ASCII files using ARCRASTER, found within Import -> Software-Specific Formats -> ESRI Formats. This operation was used to import my auto-crime maps, neighbourhood population maps, and the rapid transit station map. Although I now had a series of maps visible in raster format, none were yet compatible for use with IRDRISI operations because their varied sizes (row by column). I chose to use my neighbourhood population maps as a baseline to convert all other rasters to fit.
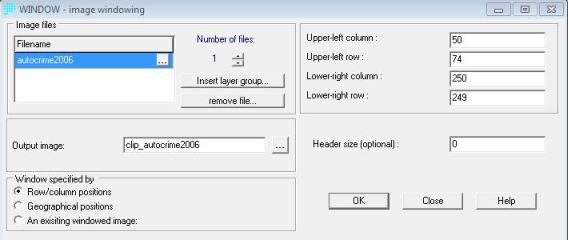
I then used the WINDOW operation to reduce the size of my auto-crime rasters so that they could be grouped for further manipulation. The image below contains the parameters that were used for all six auto-crime rasters. This allowed me to use IDRISI Explorer to group my six auto-crime raster images.
 |
Next, I used the RECLASS operation on my new group file to create six qualitative images with no autoscaling, to produce rasters with only two class designations; "0" for no occurance of an auto-crime and "1" for an occurance. I then used the RESAMPLE operation to fit my six auto-crime raster maps to match the parameters of the neighbourhood population maps. The images below show the steps taken to complete this operation, including the reference parameters.
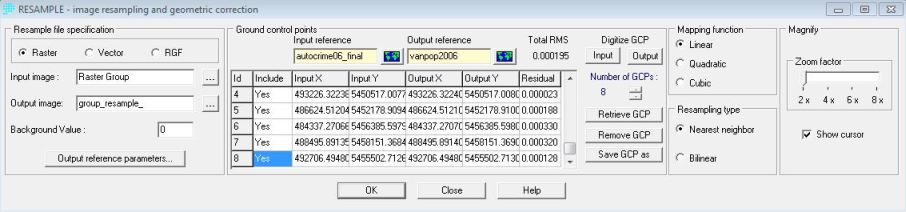 |
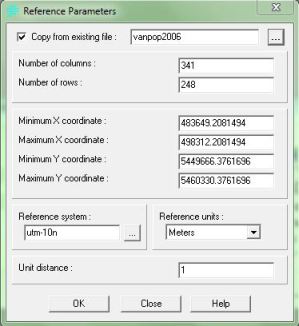 |
My RMT value for this operation was 0.000195, based on eight select Ground Control Points (GCP). This is an acceptable range to conclude that my RESAMPLE operation was accurate.
- This link provides a visual representation of my progress.
The final step to have a complete data set was to create a similar map for my rapid transit raster. After importing my rapid transit ASCII with ARCRASTER, I needed again to RECLASS and RESAMPLE this map in a similar way as done above. This, however, is where I found a minor complication. During the RESAMPLE process, the new rapid transit image created lacked many of the points that once represented stations within Vancouver. To compensate for this loss of data, I used the BUFFER operation on the rapid transit rasters with a distance of 10m. Running this image through the RESAMPLE operation with my saved GCPs from the last operation, produced an image that retained all the original rapid transit station locations, now fit to the same spatial requirements as both my auto-crime and neighbourhood population maps.
- This link provides a visual representation of my progress.
With a full set of compatable maps, I was now able to run my Spatial Analysis on crime and transit in the city of Vancouver. Please refer to my Report page for more detail on this process.