Spatial
Analysis:
The main idea of this project was to create three different images showing
the most suitable areas to place school bus stations. To do this i
used a few different types of criteria. My data had to be split up this
way to be able to effectively correspond to every aspect of my criteria.
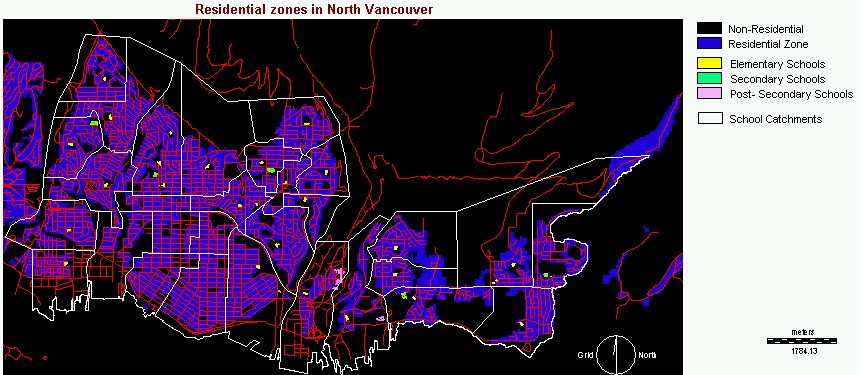
This image below was created by using four different layers including
vector and raster layers. I assigned the Landuse image to only show
residential areas LAND_ASSIGN
. I also used the SCHOOL_POLY
vector image and assigned it into the three school classes seen below.
By adding the ROADS_PROJ
and SCATH_POLYGON
i gave this map a very good overall representation of the area in question.
The distributions of schools and catchment areas are very clearly seen
with respect to residential areas and roads.
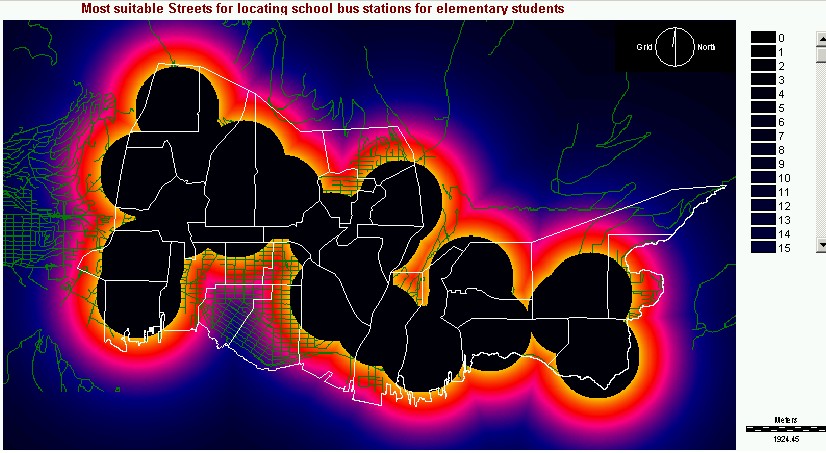
In this next image
below we can see the most suitable streets for locating a school bus station
for elementary schools.
Using the SCHOOL_ASSIGN
image, which i converted to Idrisi and assigned, i isolated the elementary
schools into ELEMBOOL
with the Reclass utility. Next i created a 1 km buffer around these
pixels. This buffer is simply my estimation of how far elementary
students are willing to travel using non automobile transport. Once
i had my buffer zones in place i decided to create a fuzzy image to provide
a more gradual illustration of distances from the schools. Using the
ELEMDIST
image i applied the Fuzzy utility using a J-Shaped curve, output data
format of byte (0-255), monotonically decreasing function shape, with control
points of 40 and 500. My next step was to overlay my
ELEMBUFF
image and the ROADS
image using the first cover second function, which provided me with the
ELEMROADS
image. To achieve the image i have below i again used Overlay with
ELEMROADS
and ELEMFUZZY
which gave me EFUZZYROADS (the image below). The image below contains
the school catchment layer which serves as a boundary to my image. Any
roads outside this catchment boundary are not suitable for school bus station
placement. The areas which fit into this boundary and are outside the
buffer zone are the most suitable. The fuzzy colour gradiant shows
distances from the buffer zone, therefore the areas with the highest density
of road within the gradiant would be considered most suitable.
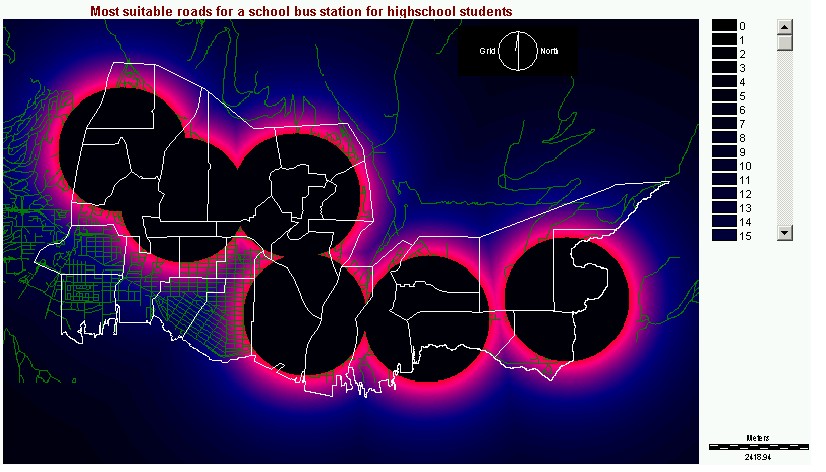
The next image below
is showing the best areas for locating school bus stations to service high
school students. The steps to creating this image are pretty much the
same as the image above except addressing only high schools. Therefore
using the SCHOOL_ASSIGN
image i created HIGHBOOL
. Using a 1.5 km buffer, due to the fact that high school students
are willing to travel further using non automobile transportation, i created
HIGHBUFF
. Using the same settings for the Fuzzy utility as above, i created
HIGHFUZZY
from the HIGHDIST image. By overlaying the
HIGHBUFF
and ROADS
image i came up with HIGHROADS
and then overlaid it with HIGHFUZZY
. After all this i came up with my final image seen below which i
called HFUZZYROADS. Yet again the most suitable areas for school bus
pick ups and drop offs would be in road areas outside the 1.5 km buffer and
within the school catchment boundaries.
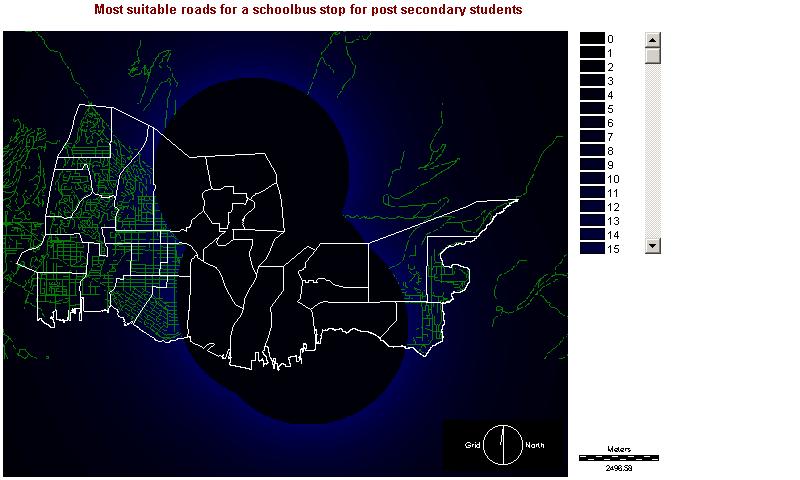
This is my third and
final image. This last image shows the most suitable areas for school
bus stops in terms of post secondary schools. As i did for the first
two images above, the same steps were taken to create this except for using
post secondray schools. I will jump through the steps very quickly
here just to show the images of the process.
POSTBOOL
image isolated the post secondary institutions. Using a 3 km buffer
i thought was necessary in this analysis because there are only two institutions
of this kind in this district. These are Capilano College and Canadian
International College. The fact that there are only two institutions will
increase the buffer zone significantly. This buffer analysis provided
me with POSTBUFF
image. And again the POSTFUZZY
image was created by using POSTDIST
as the input file. By overlaying the ROADS
and POSTBUFF
i came up with POSTROADS
. To finalize this third image i overlaid the
POSTFUZZY
and POSTROADS
leaving me with PFUZZYROADS, the image below.
The analysis above
clearly indicates the most suitable areas for locating the school bus stops
in case this idea is further developed. This project addresses the
problems with traffic congestion in North Vancouver and by implementing a
program such as this one many would benefit in more ways than one.
Back to Top.
 BACK TO METHODOLOGY
TO PROBLEMS AND ERRORS
BACK TO METHODOLOGY
TO PROBLEMS AND ERRORS
 PROJECT HOME