Methodology:
The Cartographic model
of my project.
I have split my project into three sections. First part concentrates
on elementary schools in North Vancouver. The second, on highschools
and the third on the two post secondary institutions. I had to do
this because each school category has different caracteristics and cannot
be combined. For example, highschool students are more likely to
walk, ride a bike or use some other mode of transportation to school if
within their buffer zone, where as a higher precentage of elementary students
would get a ride from thier parents due to security issues. Post secondary
students have the greatest ability to access car use. Therefore these
three school categories require different sized buffer zones and must be
addressed separately.
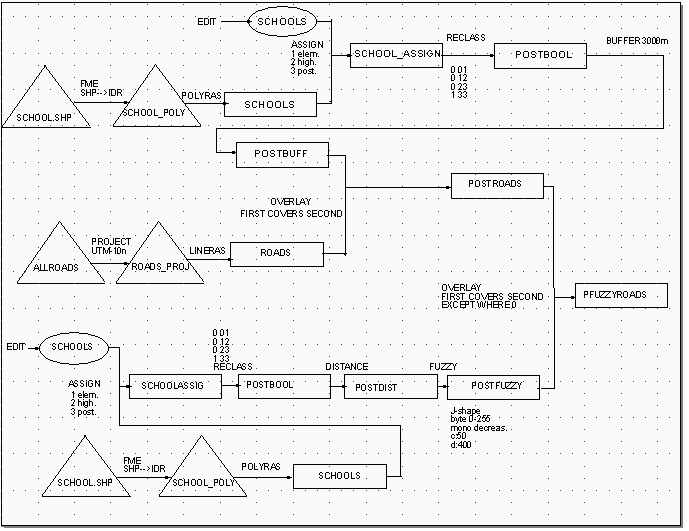
1) Cartographic model for the highschool analysis.
Using the school polygon shape file i created a buffer file for each type
of school. A 1500 buffer was used in this case because i estimated
that 1.5 km was the furthest high school students are willing to travel by
walking, or other non viechle truansportation.

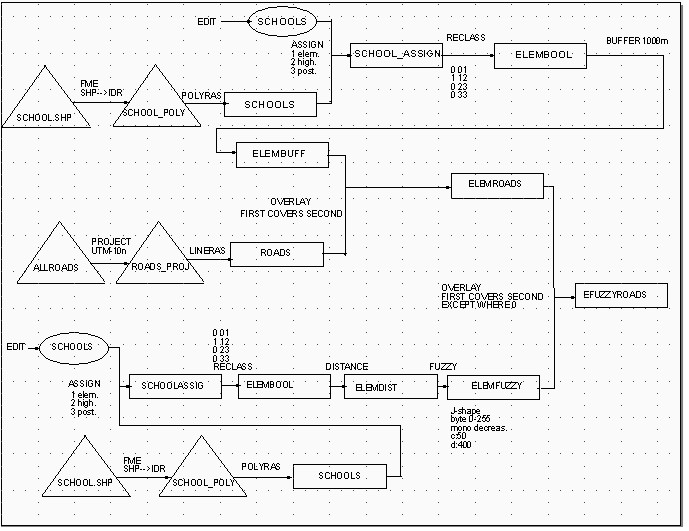
2) Cartographic model
for the elementary school analysis.
3) Cartographic model for the post secondary school analysis.
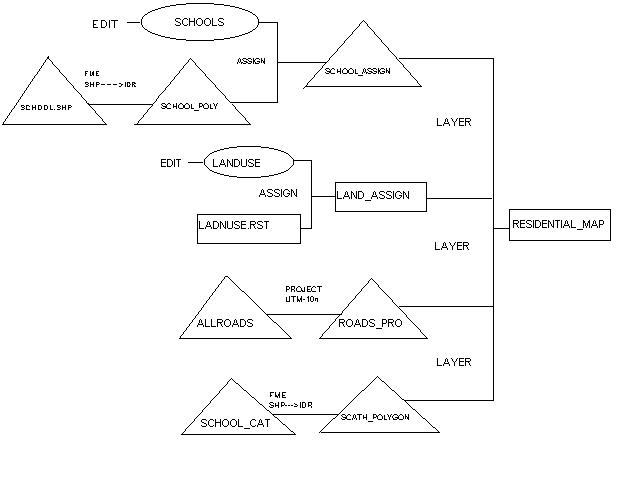
4) Cartographic model
of the myltiple layer map of North Vancouver. For this image i combined
four different layers to display schools in thier categories, residential
areas, school catchment areas, and the road network.
The main idea of this project was to create three different images showing
the most suitable areas to place school bus stations. To do this i
used a few different types of criteria.
Back to top.
 BACK TO DATA COLLECTION
TO ANALYSIS
BACK TO DATA COLLECTION
TO ANALYSIS
 PROJECT HOME