 SPATIAL ANALYSIS AND RESULT (coun't)
Index
Page
Background
Methodology
Data Collection
Data Manipulation
Spatial Analysis and Result
Problems
Analysis:
Criteria 1
Criteria 2 & 3
Criteria 4
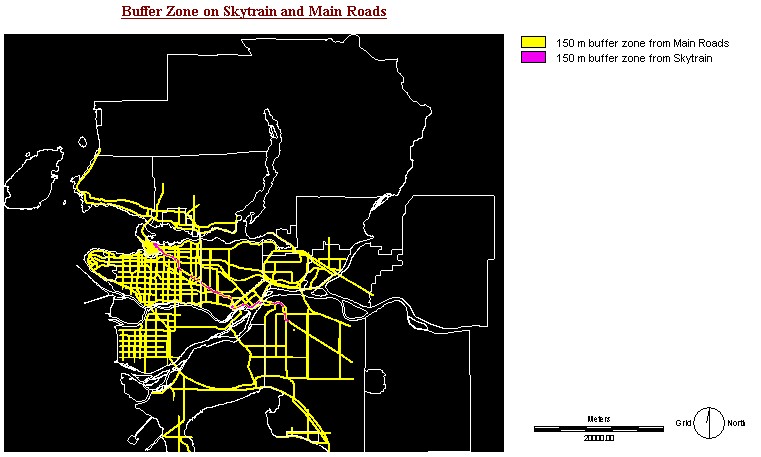
Criteria 2: Proximity to Skytrain and Main Roads
Skytrain and public
transit is another factors on location analysis. It is not an essential
"must" but it can help the homeless people to get to shelters or to any
food aid organization. The 150 meters buffer zone is set to accommodate
the both sides (explained in Methodology).
Again this criteria is only a factor, it is not enough to determent a location
for homeless shelters.
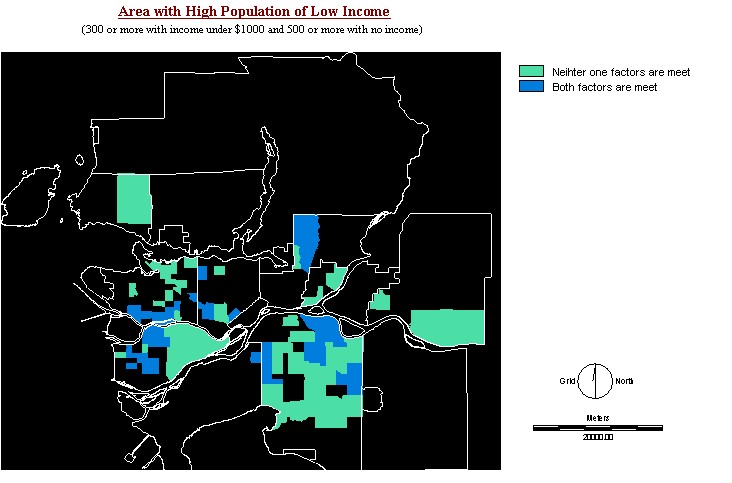
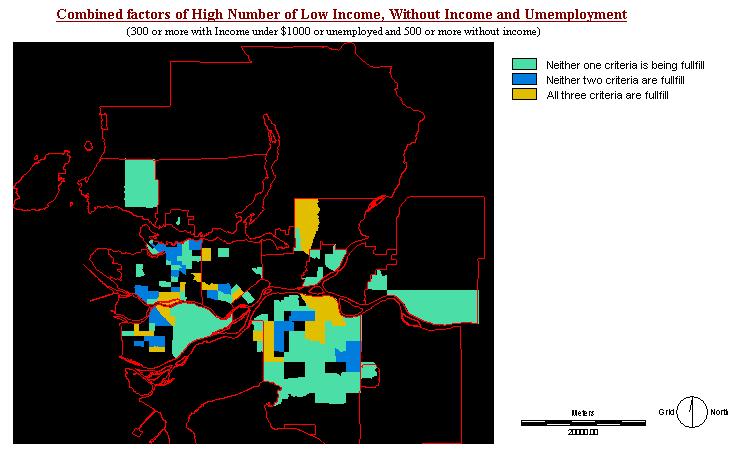
Criteria 3: Socio-economic indicator
The first indicator
to find homeless people is the income level. The areas with high
population of income under $1000 or without income are most likely to have
higher population of homelessness. As show in the map, the green
parts meet neither one factors and the blue areas are having both
high population of low income and without income. There is a concentrated
high number in Southern part of Vancouver, North & East Richmond, along
the boundary of city Burnaby and Vancouver and some part in Surrey.
One of the interested blue area is in north Coquitlam where known as the
"West Wood plateau". For my knowledge, the area should be a high
class residential area, and it surprisingly show up as a high low income
area. It most likely not a suitable area for homeless shelters.
The unemployment
is than add on the low income factors. The yellow areas meet all
three factors and again the four region mentioned in the last image are
still dominantly in high number. The "west wood plateau" are
is still inside the margins. Other than looking at all three factors,
the second best fit criteria (blue area) could also taken into account.
There is a large area in east Richmond and Surrey under this category but
what I would more concern is the downtown east-side area and area along
Kingsway.
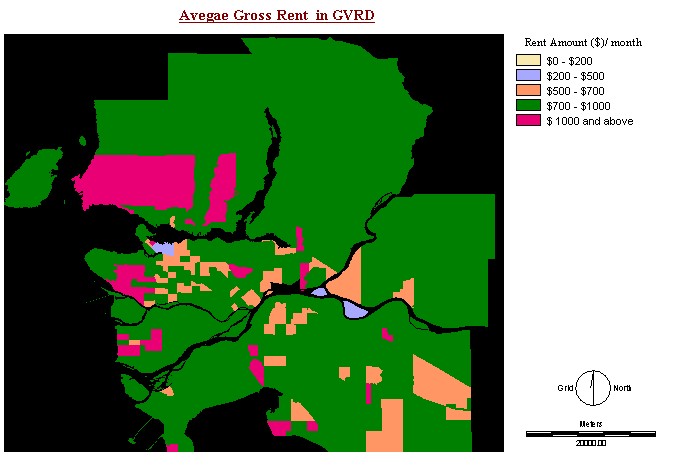
One additional indicator I added on, is the average
rental fee in the GVRD. Again this factors is only act as a supporting
references. The purple area is the area with low average rental fee.
The only areas that show up in this category are downtown east-side and
two remote islands. The reason for the two island show up as this category
properbly due to low residential population. It could understand
that low rental fee make homeless or low income people stay in that area
where necessity are more affordable.