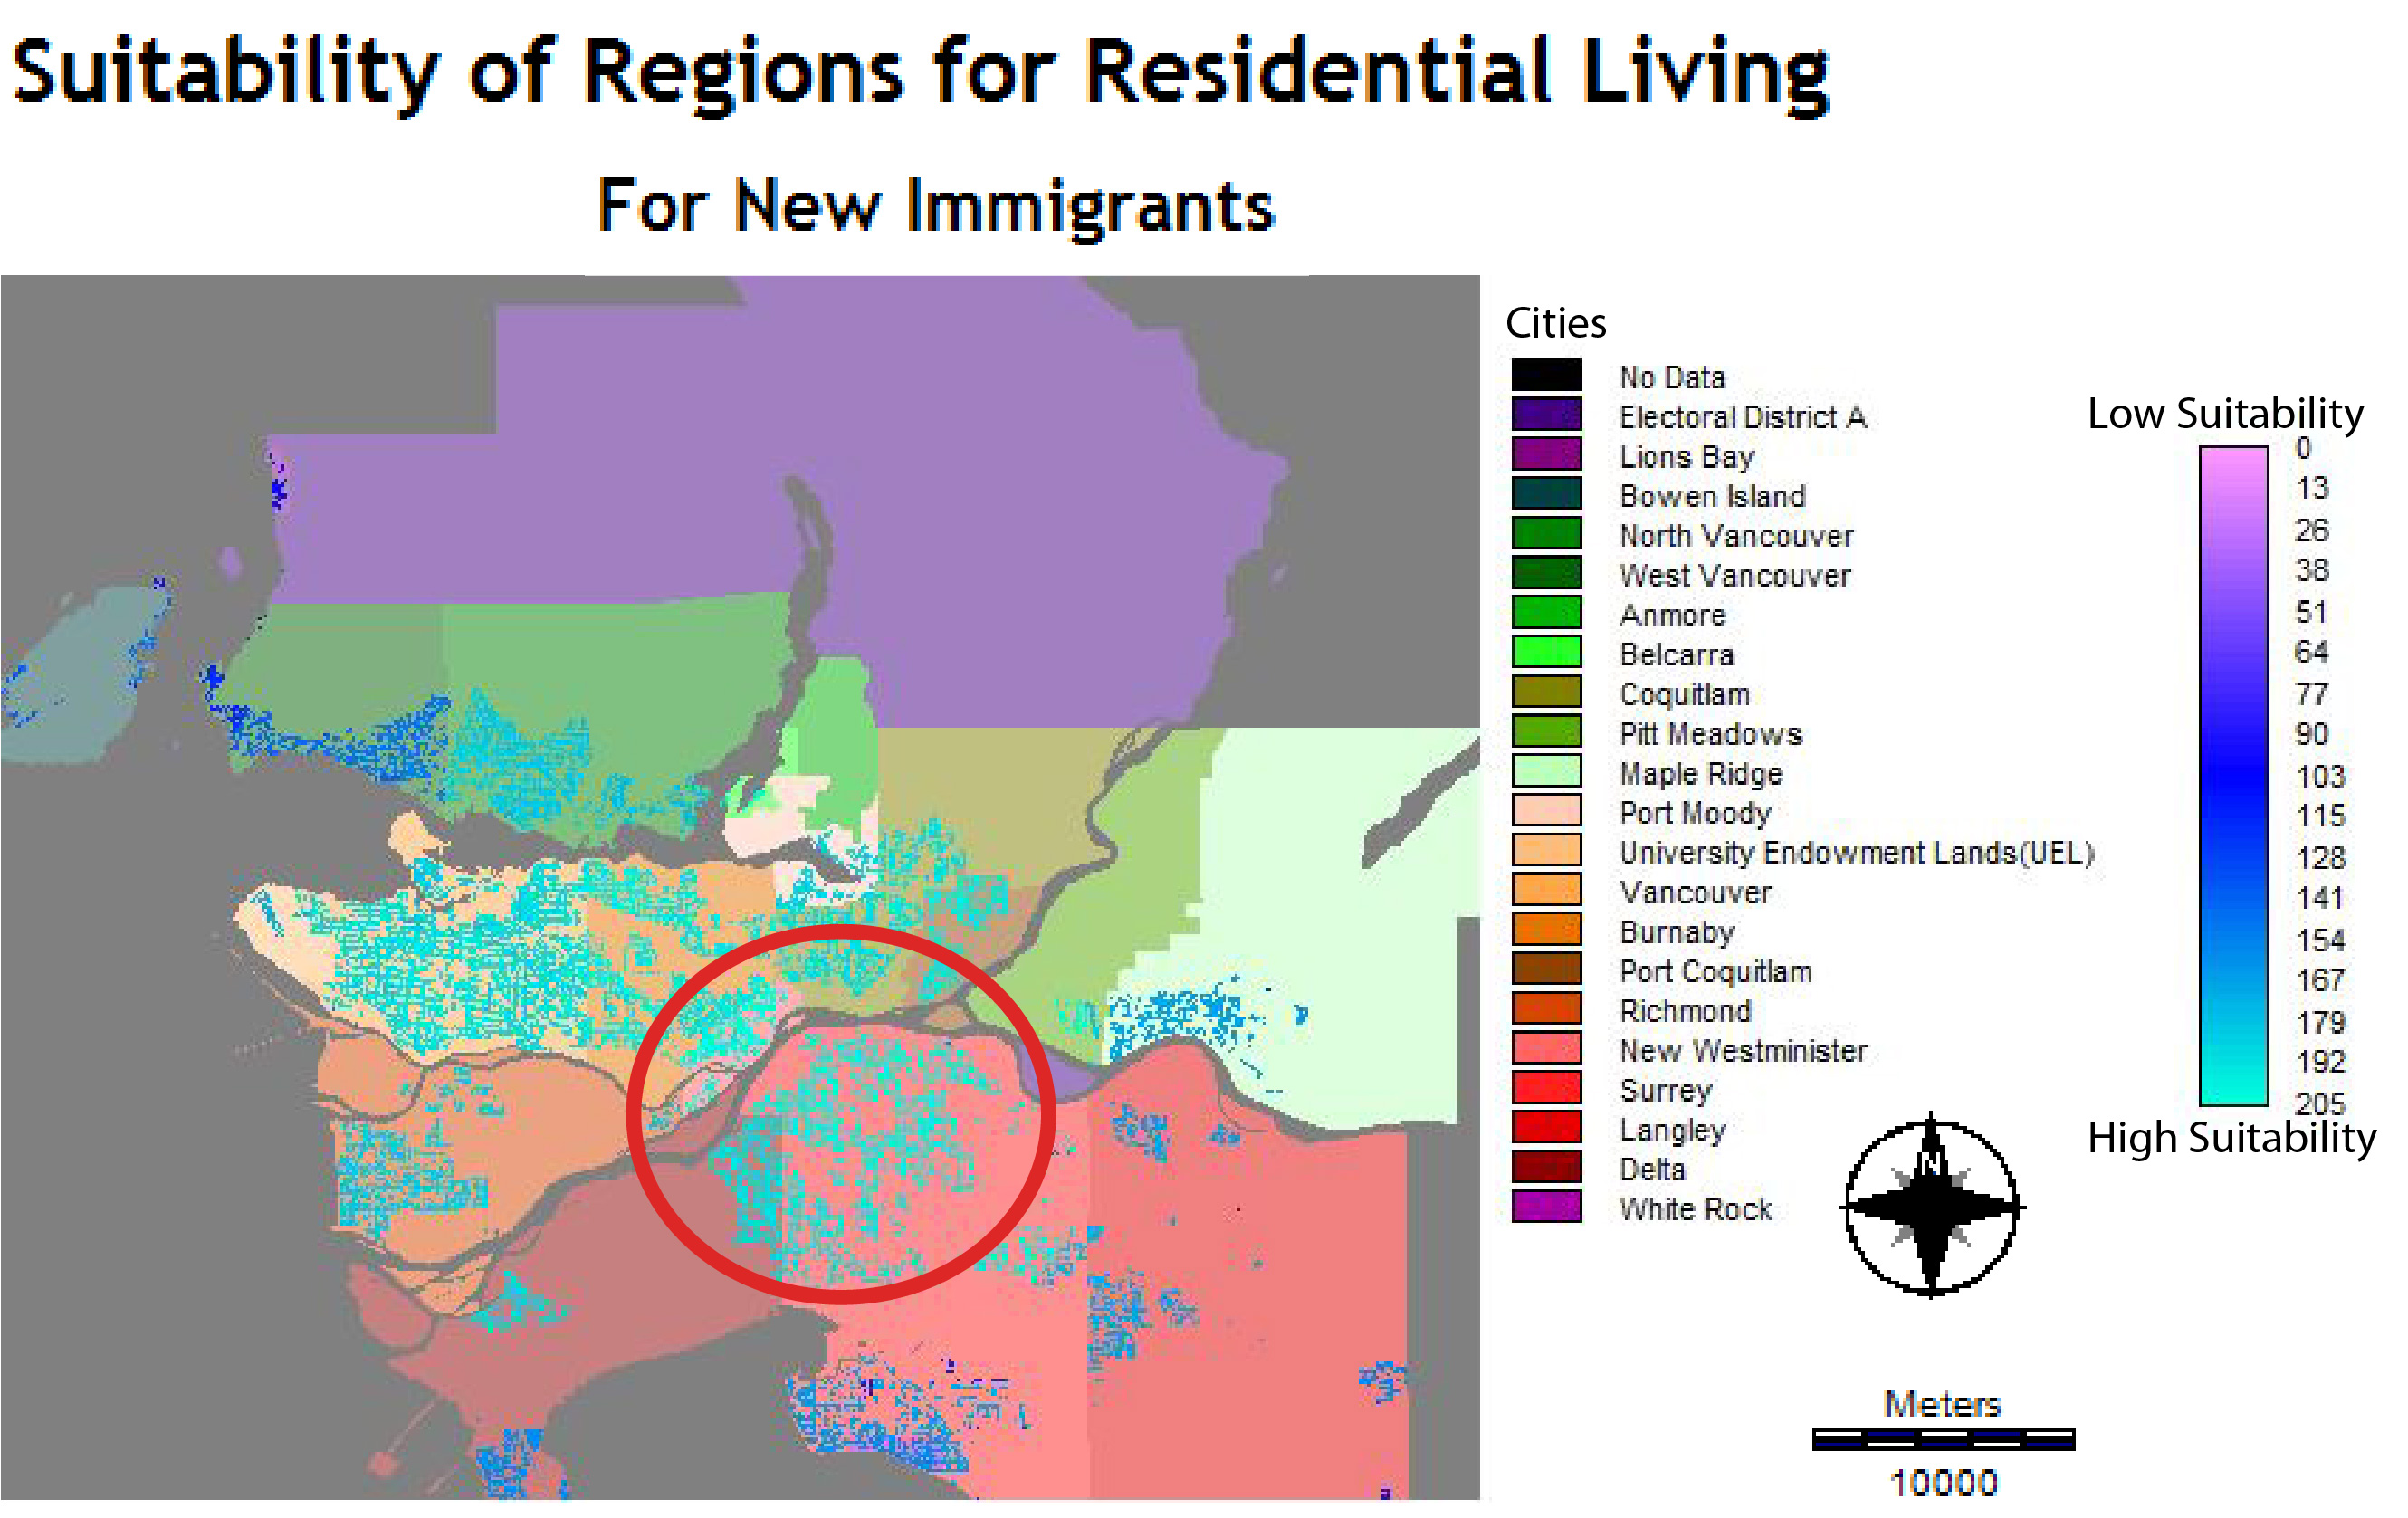
After the MCE was performed the resulting image(in the Spatial Analysis section) only indicated the level of suitability of each cell for the entire study area. To attain a better understanding of what the results indicate, an Overlay has to be performed. Using the OVERLAY module the resulting MCE image was laid over the study area image containing all the cities. The image below (Image 1) aims at determining the area or city within which there is the highest level of suitability. Due to the close range of values the map may be difficult to comprehend, however the results indicate that the area within the red circle have highest level of suitability. This means that the most suitable regions for new residents to live in include majority of the city of Surrey and New Westminster. In addition, certain areas in Burnaby and Coquitlam can also be considered as highly suitable. The areas that are least suitable include regions of Lions Bay, segments in West Vancouver, and certain areas in Richmond.

The results may be of this form due to several reasons. Rent was lower in New Westminster and Surrey in comparison to other regions as is displayed in the Methodology section. It may also be of the reason that there was easy access to bus routes in those regions. In addition areas such as Lion's Bay may have low suitability values due to lack of access to bus routes and sky-train lines. West Vancouver represents the city with the highest average rent and this may have substantially influenced the suitability value within the city.
Further research about the area and additional factors that may influence and individual's choice of where to reside can potentially improve the results obtained. If further analysis were to be conducted, additional factors such as location of schools (for new immigrant families with children) and public services may aid in providing results that are more accurate.
Two types of problems were encountered throughout the different stanges of project development. The types of problems encoutered are data problems and operational problems.
Data Problems:
- There are differences in the data collected originally for analysis. Data used for this study were accumulated in different years. For example the land-use data utilized to determine the different residential types was from 2001. On the other hand the data for bus routes and sky-train lines were from 2010. In addition average rent values utilized for the analysis was collected in 2006. The issues that arise here are that there can be substantial difference in the level of residential land cover from 2001 to 2010 or 2006. This issue may have caused an error in the analysis and in the final result.
- Another data problem encountered is that of digitizing the data. All the data containing the addresses of libraries and shopping centres were found on various websites. There may have been loss of data if one of the libraries or shopping centre was not found on a website and thus was not digitized. Also during digitizing process there may have been errors on where each point was established with reference to their original location.
- Rasterizing data from vector files results in loss of data and accuracy.
Operational Problems:
- Resampling the data to match the size and format of the other data layers can result in error. There can be inaccuracies in the Ground Control Point values from that of the image being resampled to that of the reference image.
- Another operational problem is that of setting the pair wise comparison values. From research, personal experience and interviews it was determined that certain factors should be of more importance than others, however it was not determined how much more important that factor would be in comparison to the others. Utilizing a different set of pair wise comparison values would have resulted in a different conclusion, thus this is a significant operational problem to consider.