STAT 330 Lecture 36: Review of Course
You will need to be able to recognize, in a problem description,
the following experimental or sampling designs. For each context i
have prepared a list of techniques you are expected to be able to
apply:
- One simple random sample
- Tests of
 with either 1 sided or
two sided alternatives or tests of
with either 1 sided or
two sided alternatives or tests of  (or
(or  )
against a one sided alternative.
)
against a one sided alternative.
- Confidence intervals for the true value of
 based on the
same distributional considerations as for the hypothesis tests.
based on the
same distributional considerations as for the hypothesis tests. - Confidence intervals for
 based on the
  distribution.
Don't forget to distinguish between the variance
distribution.
Don't forget to distinguish between the variance  and the
standard deviation .
and the
standard deviation . - Hypothesis tests for
 (or with
  or
based on the distribution.
You need to be aware that this test requires that the
population distribution be normal, even in large samples.
or
based on the distribution.
You need to be aware that this test requires that the
population distribution be normal, even in large samples. - Power calculations. You should know how to compute
 making
a normal approximation for a problem in which is known.
making
a normal approximation for a problem in which is known. - Sample size calculations for one or two tailed hypothesis tests when
you are given: specified Type I error rate
 , specified Type II
error rate , specified null hypothesis value
, specified Type II
error rate , specified null hypothesis value  , specified
discrepancy between the true value and the hypothesized value
. (You need to know
, specified
discrepancy between the true value and the hypothesized value
. (You need to know 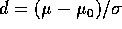 and you might be told
that or you might be told and separately.
and you might be told
that or you might be told and separately.
- Replicate measurements under identical circumstances of a single
quantity: This is treated the same way as a single sample problem. We use
the model

where the  are independent and identically distributed from
a population with mean 0 and variance . In this case we regard
the measurements
are independent and identically distributed from
a population with mean 0 and variance . In this case we regard
the measurements  as a sample from an infinite population whose
mean is and
as a sample from an infinite population whose
mean is and

Techniques are all the same as the previous problem. There is one further
sort of problem I could ask about. Measuring instruments can be calibrated
by making a measurement where the true value is known (such as
weighing an object whose weight is accurately known). Testing  is the same as testing
  .
.
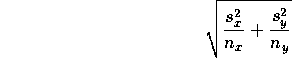
- Two independent random samples
- Test the hypothesis
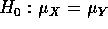 (or with or )
with one or two tailed alternatives.
(or with or )
with one or two tailed alternatives.
- Confidence intervals for
 with the same considerations
for estimating the standard error of
with the same considerations
for estimating the standard error of  .
. - Tests of the hypothesis
 based on the F
distribution.
You need to be aware that this test requires that the
population distribution be normal, even in large samples. You need to know
how to carry out a two tailed test as well as a one tailed test.
based on the F
distribution.
You need to be aware that this test requires that the
population distribution be normal, even in large samples. You need to know
how to carry out a two tailed test as well as a one tailed test. - Confidence intervals for
 again based
on the F distribution.
again based
on the F distribution. - Sample size calculations based on normal theory. You should be
aware that when the resulting sample size is small and is not
really known you should use the graphs in the Appendix for power of the t
test.
- A sample of pairs
This is the design we have analyzed using 3 tools:
- To test for equality of means use a paired comparisons t-test.
You should know how to get confidence intervals for the difference
in means and how to do a sample size and power calculation in this
setting. (You use 1 sample ideas on the differences
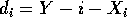 .)
.) - To predict Y from X use regression. (See the discussion
below for what you need to know about regression.
- Correlation analysis. You need to be able to do tests of
 and get confidence intervals for
  based on Fisher's z-transform.
- I samples: the one way layout
- ANOVA table: properties, degrees of freedom, sums of squares, mean squares
and so on.
- Tests of
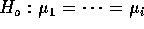 .
. - Model equation
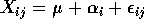 .
. - Confidence intervals for
 :
:
- One at a time: t intervals.
- Simultaneous: Tukey.
- Diagnostic plots.
- Two factor designs
- Completely randomized. Experimental units are assigned
at random to levels of each of two factors.
- Randomized (Complete) Blocks. One of the factors is a
blocking factor; the level of such a factor to which an experimental
unit belongs is generally beyond the control of the experimenter.
- Two factor designs with replicates
- ANOVA table has rows: Factor A, Factor B, Interaction, Error and Total.
- Know properties of ANOVA table.
- Test for interactions.
- If no interactions are detected test for main effects.
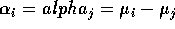
- Model equation:
 .
. - One at a time (t) and simultaneous (Tukey) confidence intervals for
 .
. - Diagnostic plots.
- Two factor designs without replicates
- ANOVA table has rows: Factor A, Factor B, Error and Total.
- Know properties of ANOVA table.
- Test for main effects.
- Model equation:
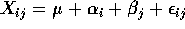 .
. - One at a time (t) and simultaneous (Tukey) confidence intervals for
.
- Diagnostic plots.
Coverage of course in textbook
- Chapter 6: all except from foot of page 253 to middle of page 257.
- Bias
- Mean Squared Error
- Standard Error
- Estimated Standard Error
- Method of Moments
- Maximum likelihood estimation
- Chapter 7: all . Confidence Intervals.
- Chapter 8: all . Hypothesis tests.
- Theory: level, power, probability of Type 1, 2 errors, P-values, fixed level tests.
- Practice: all cases as above for confidence intervals.
- Power calculations.
- Sample size determination.
- Chapter 9: all . Two sample problems.
- Tests and confidence intervals for differences of two proportions, rates or means.
- Power and sample size calculations.
- F tests for equality of variances.
- Standard errors for differences.
- Pooled estimate of .
- Paired comparisons analysis.
- Chapter 10: omit power, sample size and random effects models
- One way ANOVA.
- Tests for
 .
. - One at a time t type confidence intervals for contrasts.
- Simultaneous Tukey confidence intervals for differences
 .
. - Model equations.
- Chapter 11: Sections 1 and 2 only
- Two way ANOVA with and without replicates.
- Tests for interactions and main effects.
- Model equations.
- Confidence intervals for .
- t type confidence intervals of the form
 .
.
- Chapter 12: All except coefficient of determination, Bonferroni intervals. Simple Linear Regression and Correlation.
- Least squares, least squares estimates.
- Tests, confidence intervals for slope (intercept).
- Confidence intervals for
 .
. - Prediction intervals.
- ANOVA table.
- Tests, confidence intervals for .
- Residual plots.
- Open Book, 3 hours.
- You will need your text for tables.
- You will need a calculator.
- You may bring your notes and other books if you like.
- There will be a number of questions where I provide two or more
SAS outputs which purport to analyze a certain experiment. You must
pick the correct one use it to answer the question.
- You should use P-values whenever possible.
- There may be a question of the type where the SAS output is edited
and you are asked to fill in the rest of the ANOVA table. If so you will
have to do fixed level testing.
- The whole course is covered with emphasis on the second half.
- There will be 6 to 8 questions.
Richard Lockhart
Wed Apr 1 15:11:22 PST 1998