STAT 330 Lecture 20
Reading for Today's Lecture: 10.1.
Goals of Today's Lecture:
Today's notes
The ANOVA Table for a 1 way layout or an I sample problem
We generally record the arithmetic of our analysis in a table called an ANOVA table.
| Sum of | Mean | ||||
| Source | df | Squares | Square | F | P |
| | I-1 | ||||
|
| n-I | | |||
| Total | n-1 | |
We can fill in all the rest from this much.
The sum of squares decomposition in one example
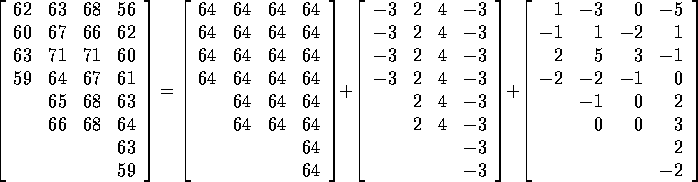
The data consist of blood coagulation times for 24 animals fed one of 4 different diets. Here is the data:
| A | B | C | D |
| 62 | 63 | 68 | 56 |
| 60 | 67 | 66 | 62 |
| 63 | 71 | 71 | 60 |
| 59 | 64 | 67 | 61 |
| 65 | 68 | 63 | |
| 66 | 68 | 64 | |
| 63 | |||
| 59 |
We have ![]() ,
, ![]() and
and ![]() .
.
Here is the ANOVA table.
| Sum of | Mean | ||||
| Source | df | Squares | Square | F | P |
| Diet | I-1 | 228 | | |
|
| Error | n-I=20 | 112 | | ||
| Total | n-1=23 | 340 |
Before I continue with the mathematics of the table I want to highlight the conclusion. There is overwhelming evidence that the diets lead to different mean blood coagulation times.
To fill in the table I needed to calculate various statistics such as
![]()
![]()
Similarly for diets B, C and D gives
![]()
and so on.
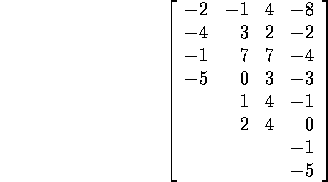
In the following I write the data in a table and decompose the table into a sum of several tables. The 4 columns of the table correspond to Diets A, B, C and D. Later in the course we will do matrix linear algebra and then want to think of stacking up these 24 values into a single column vector but the tables save space.
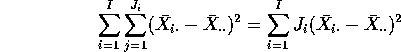
The sums of squares of the entries of each of these arrays are
intervals for differences between the 4 population means.
On the left hand side ![]() . This is the
uncorrected total sum of squares. The first term
on the right hand side gives
. This is the
uncorrected total sum of squares. The first term
on the right hand side gives ![]() . This term
is sometimes put in ANOVA tables as the Sum of Squares due to the
Grand Mean but it is usually subtracted from the total to produce the
Total Sum of Squares we usually put at the bottom of the table
and often called the Corrected (or Adjusted) Total Sum of Squares.
In this case the corrected sum of squares is the squared
length of the table
. This term
is sometimes put in ANOVA tables as the Sum of Squares due to the
Grand Mean but it is usually subtracted from the total to produce the
Total Sum of Squares we usually put at the bottom of the table
and often called the Corrected (or Adjusted) Total Sum of Squares.
In this case the corrected sum of squares is the squared
length of the table
which is 340.
The second term on the right hand side of the equation has squared length
![]() (which is the Treatment
Sum of Squares produced by SAS). The formula for this Sum of Squares is
(which is the Treatment
Sum of Squares produced by SAS). The formula for this Sum of Squares is
but I want you to see that the formula is
just the squared length of the vector of individual sample means minus
the grand mean. The last vector of the decomposition is called
the residual vector and has squared length ![]() . Corresponding to the decomposition of the total squared length
of the data vector is a decomposition of its dimension, 24, into the
dimensions of subspaces. For instance the grand mean is always a multiple
of the single vector all of whose entries are 1; this describes
a one dimensional space. The second vector, of deviations from a grand
mean lies in the three dimensional subspace of tables which are constant
in each column and have a total equal to 0. Similarly the vector of
residuals lies in a 20 dimensional subspace - the set of all tables whose
columns sum to 0. This decomposition of dimensions is the decomposition
of degrees of freedom. So 24 = 1+3+20 and the degrees of freedom for
treatment and error are 3 and 20 respectively. The vector whose squared
length is the Corrected Total Sum of Squares lies in the 23 dimensional
subspace of vectors whose entries sum to 1; this produces the 23 total
degrees of freedom in the usual ANOVA table.
. Corresponding to the decomposition of the total squared length
of the data vector is a decomposition of its dimension, 24, into the
dimensions of subspaces. For instance the grand mean is always a multiple
of the single vector all of whose entries are 1; this describes
a one dimensional space. The second vector, of deviations from a grand
mean lies in the three dimensional subspace of tables which are constant
in each column and have a total equal to 0. Similarly the vector of
residuals lies in a 20 dimensional subspace - the set of all tables whose
columns sum to 0. This decomposition of dimensions is the decomposition
of degrees of freedom. So 24 = 1+3+20 and the degrees of freedom for
treatment and error are 3 and 20 respectively. The vector whose squared
length is the Corrected Total Sum of Squares lies in the 23 dimensional
subspace of vectors whose entries sum to 1; this produces the 23 total
degrees of freedom in the usual ANOVA table.
General Calculations
Here is the general formulation of this example. Write the data out as a big vector, say,
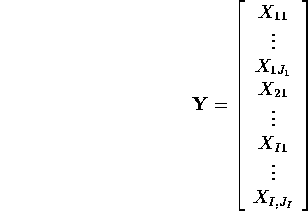
Now we write
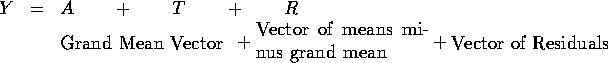
Writing the equation for a particular component of this vector we have
![]()
Here are the Geometric facts:
![]()
The squared lengths of these 4 vectors are called the Total Sum of squares
( ![]() ), the Sum of Squares due to the Grand Mean (
), the Sum of Squares due to the Grand Mean ( ![]() ),
the Sum of Squares due to Treatment (
),
the Sum of Squares due to Treatment ( ![]() ) and the Sum of
Squares due to Error (
) and the Sum of
Squares due to Error ( ![]() ).
).
![]()
and
![]()
The quantity ![]() is called the Corrected Total
Sum of Squares.
is called the Corrected Total
Sum of Squares.
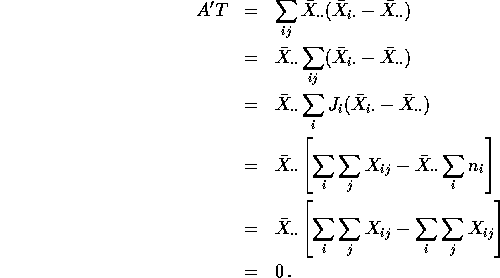
Here is a proof that A and T are perpendicular. The proofs are similar
for ![]() and
and ![]() .
.
Recall that if
and
then x and y are perpendicular ( ![]() ) if
) if
![]()
Then