STAT 330 Lecture 21
Reading for Today's Lecture: 10.1.
Goals of Today's Lecture:
Today's notes
Geometry
Write the data, ![]() out as a big vector
out as a big vector
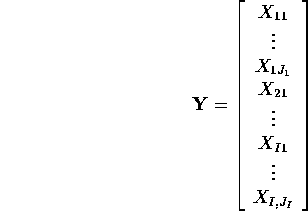
Now we write
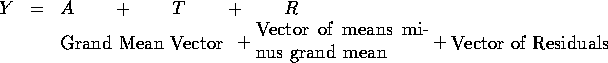
Writing the equation for a particular component of this vector we have
![]()
Here are the Geometric facts:
![]()
The squared lengths of these 4 vectors are called the Total Sum of squares
( ![]() ), the Sum of Squares due to the Grand Mean (
), the Sum of Squares due to the Grand Mean ( ![]() ),
the Sum of Squares due to Treatment (
),
the Sum of Squares due to Treatment ( ![]() ) and the Sum of
Squares due to Error (
) and the Sum of
Squares due to Error ( ![]() ).
).
![]()
and
![]()
The quantity ![]() is called the Corrected Total
Sum of Squares.
is called the Corrected Total
Sum of Squares.
Here is a proof that A and T are perpendicular. The proofs are similar
for ![]() and
and ![]() .
.
Recall that if
and
then x and y are perpendicular ( ![]() ) if
) if
![]()
Then
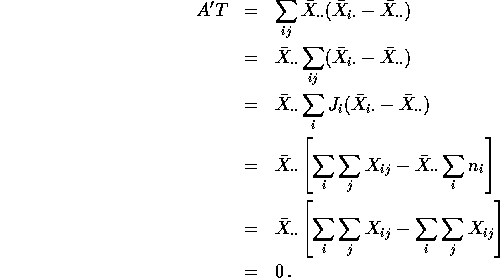
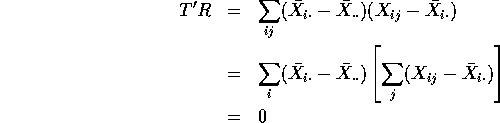
because ![]() . The sum of deviations from
average in any list is 0. This shows
. The sum of deviations from
average in any list is 0. This shows ![]() .
.
Model equations
For this section we take all ![]() -- all sample sizes equal.
-- all sample sizes equal.
Our model is
![]()
which we can rewrite as
![]()
If we define ![]() which we
call the underlying, or true, residuals
and we define the population Grand Mean by
which we
call the underlying, or true, residuals
and we define the population Grand Mean by
![]()
and we can write
![]()
We call this equation a Model Equation. The three pieces of the right hand side of this equation correspond to three pieces on the right hand side of our decomposition of the data
![]()
and we have
![]()
![]()
This identities for the equal sample size case motivate the general definition for unequal sample sizes
![]()
and
![]()
It is automatically true that
![]()
Least squares
Write our model as
![]()
where the errors ![]() are iid
are iid ![]() .
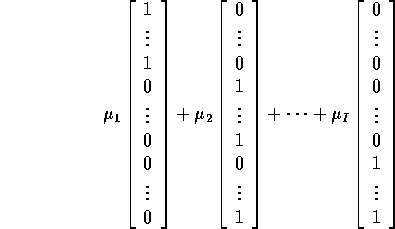
If we stack up our data in the vector Y as
.
If we stack up our data in the vector Y as
then the method of least squares consists of estimating ![]() ,
,
![]() by finding the vector of the form
by finding the vector of the form
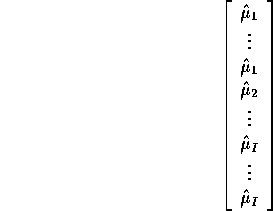
which is closest to the data vector Y. We measure distance in the usual Euclidean distance way. The solution is to find the orthogonal projection of Y onto the space of vectors of the form
It is then automatic that the projection of Y is perpendicular to Y minus the projection of Y.
How do we compute this projection? We find the vector
closest to Y by minimizing the squared distance from this vector to Y. This squared distance is just
![]()
To minimize this we set the partial derivatives with respect to each
![]() equal to 0 for
equal to 0 for ![]() . We get
. We get
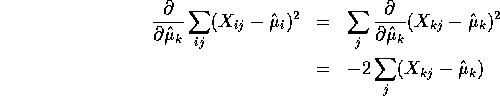
which is equal to 0 if and only if
![]()
This method is called least squares.
Remark: This method shows that A+T (which is the projection of Y) is perpendicular to R (which is Y-(A+T) by definition).
Null hypothesis Case
If ![]() is true then the model equation is
is true then the model equation is
![]()
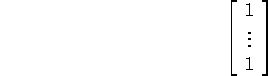
If the errors were 0 then the vector Y would simply be

We find the vector of the form

closest to Y. Again we project Y onto the subspace of vectors spanned by
by minimizing the squared distance which is
![]()
This is minimized by
![]()
Least squares and maximum likelihood
The likelihood function is

If we assume that the null hypothesis is true then the likelihood simplifies to
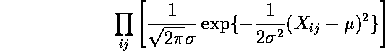
The log likelihood is
![]()
or in the null hypothesis case
![]()
To find the MLE of the parameters ![]() and
and ![]() we
must maximize these log likelihood functions. But notice that the
we
must maximize these log likelihood functions. But notice that the ![]() 's
occur only in the sums of squares which are multiplied by a negative sign.
For any value of
's
occur only in the sums of squares which are multiplied by a negative sign.
For any value of ![]() we can choose the
we can choose the ![]() 's to maximize the log
likelihood by minimizing the sum of squares. This means:
's to maximize the log
likelihood by minimizing the sum of squares. This means:
Least squares is the same as maximum likelihood for normally distributed errors -- at least in terms of estimating means.
What do you do after testing ![]() ?
?
In our coagulation example we concluded that all the mean coagulation times were not the same. What next?
1: Model diagnostics
1: Confidence Intervals
![]()