STAT 330 Lecture 18
Reading for Today's Lecture: 9.5, 10.1.
Goals of Today's Lecture:
Today's notes
We will test the hypothesis ![]() in 2 independent
samples
in 2 independent
samples ![]() ,
, ![]() using a variance ratio
using a variance ratio
![]()
and get P-values from ![]() .
.
Example: for Michelson data n=m=20 and
![]()
In F tables we find
![]()
and
![]()
so that P < 0.01 for a one sided test. In fact, using SPlus I get P=0.003 one-sided and P=0.006 for a two sided test. Conclusion: The SD of the measurement error has clearly changed from the first 20 to the last 20 measurements.
Next topic: Use same style of test to test
![]()
for I>2. This is the so-called ``I sample problem''.
More than 2 samples
Data:
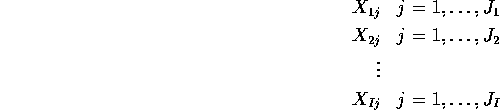
Jargon: ``I levels of some factor influencing the response variable X.''
The idea is that ![]() s are results for treatment 1, etc.
s are results for treatment 1, etc.
Note: in book ![]() which is generally a good design.
which is generally a good design.
Model:
Problems of interest:
We do (2) first:
Technique: ANalysis Of VAriance or ANOVA.
Idea: Compare two independent estimates of ![]() using an F test.
using an F test.
The theory:
1: In each sample we have an estimate
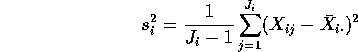
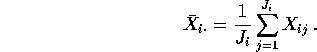
where ![]() is notation for the average of the
is notation for the average of the ![]() sample:
sample:
We pool these estimates to get the Mean Square for Error or MSE
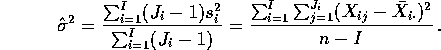
where ![]() is the total number of observations in all the samples
and
I is the number of samples.
is the total number of observations in all the samples
and
I is the number of samples.
2: The other ``estimate of ![]() '' is valid only if
'' is valid only if ![]() is true.
If
is true.
If ![]() and all the
and all the ![]() then
then
![]() are an iid sample of size I
from
a population which has a
are an iid sample of size I
from
a population which has a ![]() distribution. The
sample
variance of the
distribution. The
sample
variance of the ![]() is
is
![]()
where now

This sample variance is an estimate of the population variance ![]() and
can be used to estimate
and
can be used to estimate ![]() by multiplying by n.
by multiplying by n.
Our tests of the hypothesis of no difference between the means ![]() to
to
![]() will be based on the ratio of these two estimates of
will be based on the ratio of these two estimates of ![]() . The
crucial factor is that the second estimate of
. The
crucial factor is that the second estimate of ![]() was derived by
adding the assumption that the null hypothesis is TRUE so that all the
was derived by
adding the assumption that the null hypothesis is TRUE so that all the ![]() are sampled from the SAME population. One other point is that the restriction
that all the sample sizes be equal is not needed, though the second variance
estimate then becomes more complicated.
are sampled from the SAME population. One other point is that the restriction
that all the sample sizes be equal is not needed, though the second variance
estimate then becomes more complicated.