Chapter Contents
Previous
Next
|
Chapter Contents |
Previous |
Next |
| Using the Output Delivery System |
The following example uses ODS to display the output in HTML with a table of contents.
The data is the population of the United States in millions recorded at ten year intervals starting in 1790 and ending in 1990. The MODEL procedure is used to estimate a logistic growth curve by nonlinear ordinary least squares.
   data uspop;
      input pop :6.3 @@;
      retain year 1780;
      year=year+10;
      label pop='U.S. Population in Millions';
      datalines;
   3929   5308   7239   9638   12866  17069  23191  31443
   39818  50155  62947  75994  91972  105710 122775 131669
   151325 179323 203211 226542 248710
   ;

   ods html body='uspop.htm'
            contents='uspopc.htm'
            frame='uspopf.htm';

   title 'Logistic Growth Curve Model of U.S. Population';
   proc model data=uspop;
      label a = 'Maximum Population'
            b = 'Location Parameter'
            c = 'Initial Growth Rate';
      pop = a / ( 1 + exp( b - c * (year-1790) ) );
      fit pop start=(a 1000  b 5.5  c .02)/ out=resid outresid;
   run;
   ods html close;
The ODS HTML statement specifies three files. The BODY= option specifies the file to contain the output generated from the statements that follow. The BODY= option is the only required option.
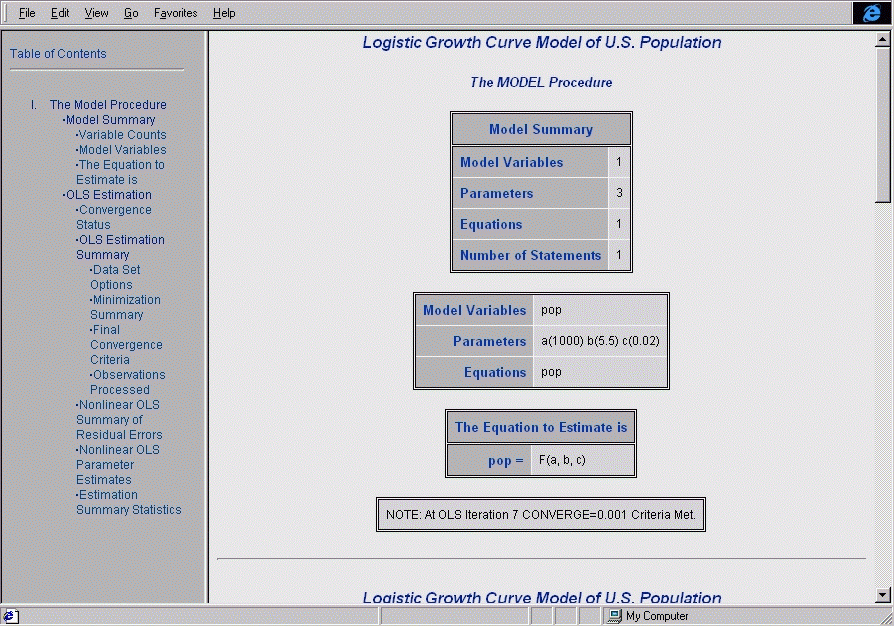
The CONTENTS= option specifies a file to contain the table of contents. The FRAME= option specifies a file to contain both the table of contents and the output. You open the FRAME= file in your browser to view the table of contents together with the generated output (see Output 6.2.1). Note that, if you specify the ODS HTML statement with only the BODY= argument, no table of contents is created.
The MODEL procedure is invoked to fit the specified model. The resulting output is displayed in Output 6.2.1.
Output 6.2.1: HTML Output from the MODEL Procedure
The table of contents displayed in Output 6.2.1 contains the descriptive label for each output table produced in the MODEL procedure step. You can select any label in the table of contents and the corresponding output will be displayed in the right-hand side of the browser window.
|
Chapter Contents |
Previous |
Next |
Top |
Copyright © 1999 by SAS Institute Inc., Cary, NC, USA. All rights reserved.