Chapter Contents
Previous
Next
|
Chapter Contents |
Previous |
Next |
| Using the Output Delivery System |
This example demonstrates how you can use the ODS HTML statement to display your output in hypertext markup language (HTML).
The following statements create the data set AR2, which contains a second-order autocorrelated time series Y. The AUTOREG procedure is then invoked to estimate the time trend of Y.
The ODS HTML statement specifies the name of the file to contain body of the HTML output.
   data AR2;
      ul = 0; ull = 0;
      do Time = -10 to 36;
         u = + 1.3 * ul - .5 * ull + 2*rannor(12346);
         Y = 10 + .5 * time + u;
         if Time > 0 then output;
         ull = ul; ul = u;
      end;
   run;

   ods html body='trend.htm';

   title 'Estimated Time Trend of Y';
   proc autoreg;
      model Y = Time;
   run;
   ods html close;
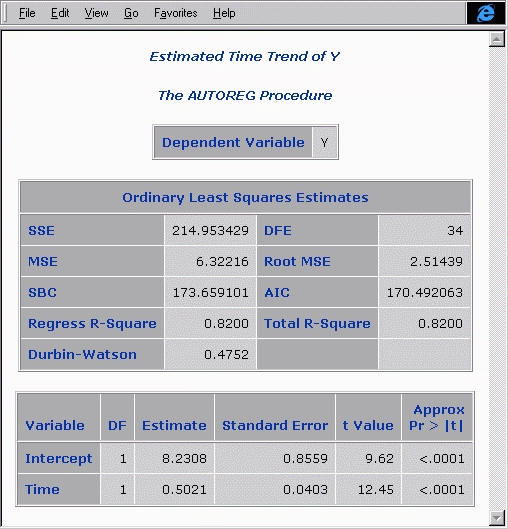
By default, the SAS listing receives all output generated during your SAS run. In this example, the ODS HTML statement opens the HTML destination, and both destinations receive the generated output. Output 6.1.1 displays the results as they are displayed in the SAS listing.
Note that you must specify the following statement before you can view your output in a browser.
ods html close;
If you do not close the HTML destination, your HTML file may contain no output, or you may experience other unexpected results.
Output 6.1.2 displays the file 'trend.htm', which is specified in the preceding ODS HTML statement.
Output 6.1.1: Results for PROC AUTOREG: SAS Listing Output
|

|
Chapter Contents |
Previous |
Next |
Top |
Copyright © 1999 by SAS Institute Inc., Cary, NC, USA. All rights reserved.