After I had manipulated the attribute file in EXCEL, I saved it as a DBASE IV-file, joined it with the original attribute table of my shapefile in ArcView and saved the join as a new shapefile, fkosovar.vct. The next step was to convert the shapefile into IDRISI with IMPORT-SHAPEIDR and then change it into a raster file with REFORMAT-POLYRAS, which lead to the final image to work with -fkosovar.rst.
This image (fkosovar.rst) I had to reclass again in order to receive a raster image (kelownaetc.rst) including only the cities Kelowna, Port Hardy and Prince George. Then I had to export the avl-files from my database and assign them to get the new raster images.
Map: Cities in B.C. included in my project
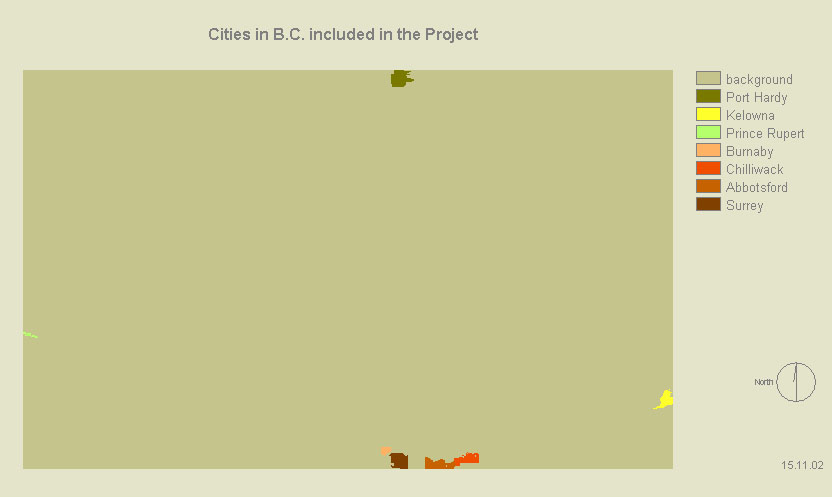
Table: Methodology Image
In the following part, I will explain, how I reclassed:
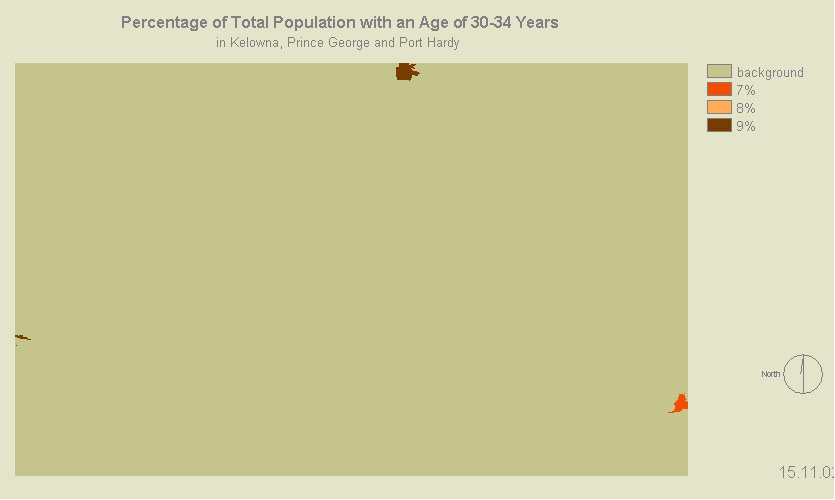
AGE
In my EXCEL table I had already rounded the values (without decimal places). In my raster image I could see, that there were only values between 7% and 9%, so due to that I reclassified:
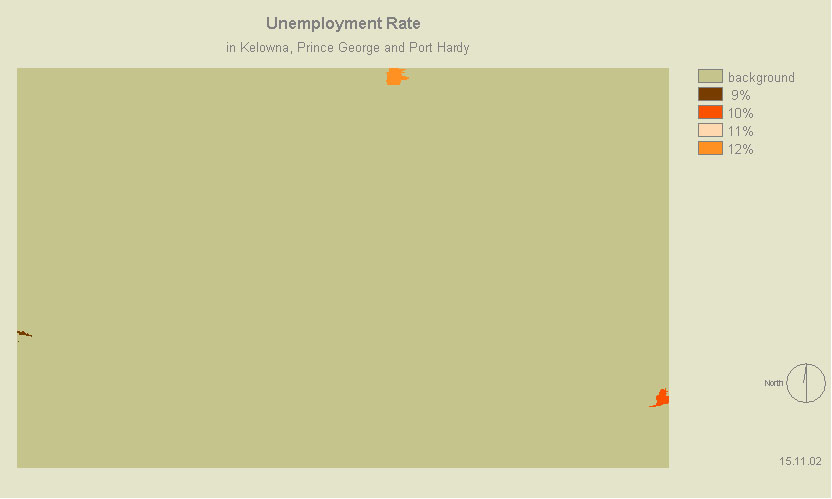
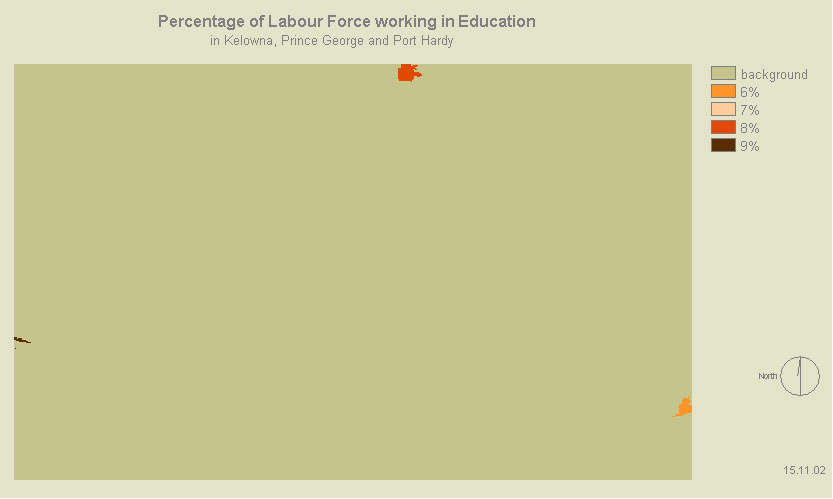
UNEMPLOYMENT and EDUCATION
As with AGE, I had changed the values in EXCEL and now reclassified them in IDRISI as there were only values between 9% and 12% for unemployment and between 6% and 10% for labour force working in educational services:
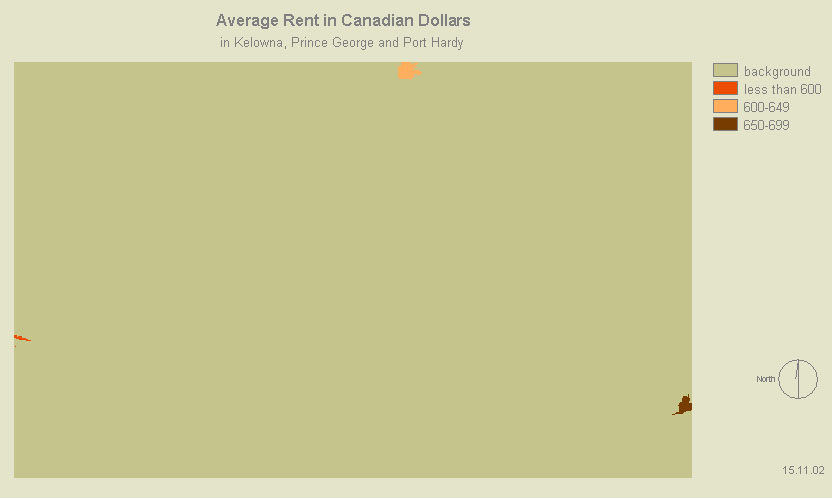
RENT
With the rent, I had to group the values, because I did noy calculate percentages here. I group them into 3 groups, as there was one city under 600, one of 639 and one 696 Dollars for average rent:
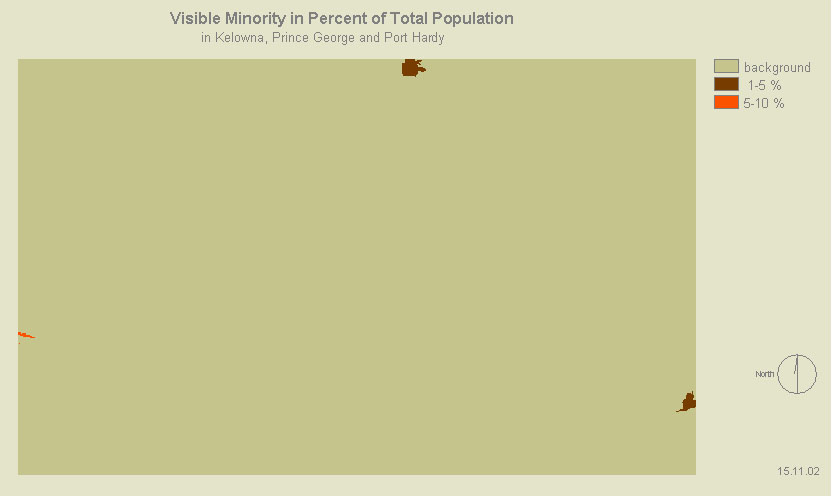
VISIBLE MINORITIES
These values I also wanted to group. I reclassified them into two groups, from 1% to 5% and from 5% to10%, as there were two cities under 5% and one over 5%:
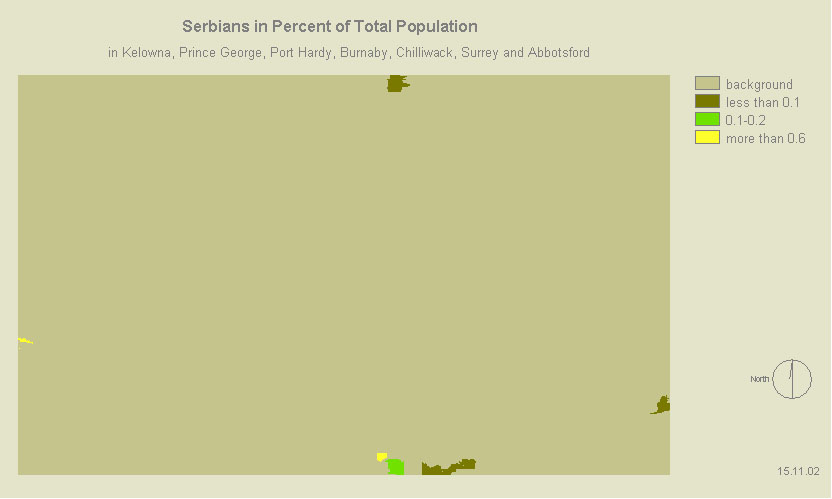
SERBIAN POPULATION
There was one more factor and one constraint I wanted to include in my analysis in the beginning, but looking at the Serbian population of the four cities (Abbotsford, Burnaby, Chilliwack and Surrey), of which I knew, that Kosovo/ar refugees were settled, I could see, that they were resettled in areas with a high Serbian population, as well as in areas with a very low one- due to this, I excluded this factor from my analysis: