 In this section I would like to mention the minor and major problems
that occurred during the work with my project.
In this section I would like to mention the minor and major problems
that occurred during the work with my project.
- One of the rather annoying problems where related to the data and the creation of the U.S. census tracts. Some of the tracts within the examined counties are unpopulated / have no permanent inhabitants. Therefore there are no data concerning e.g. ratio of a specific ethnic group or income characteristics. Of course one can say, that if there is nobody living the ratios of e.g. Asians or Public Assistance Income are zero. This is what I have assumed. But does this not appear to the unknowing user that there is an area where Asians do not want to live or that it is a rather wealthy area? This is problem which I could not solve satisfactorily. But as there are only a few census tracts (<10 out of > 2,600) with this characteristics I take the responsibility for this disregard.
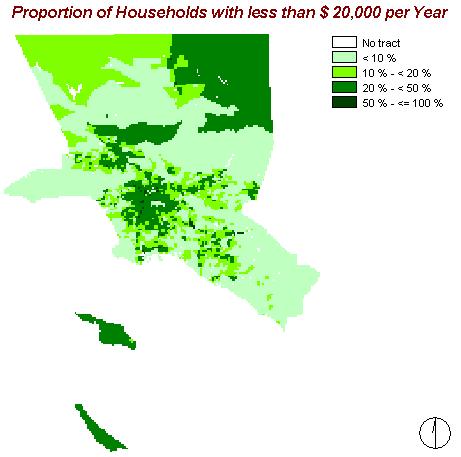
- Another problem concerning the data is the size of the universe the data is collected for. For instance there is one census tract (i.e. 218.13) that includes only ten households. Five of them receive public assistance and have a family income of less than $ 20,000 per year. The other five households earn between $ 75,000 and less than $ 100,000. The map of public assistance income will show 50% of the households in this census tract receiving public assistance. This is of course true. But the sum of only ten households is too small to make a really valuable statement.
- Furthermore one has to be careful comparing the different numbers. Here again the example of tract 218.13: as mentioned above, one half of the households earn between $ 75,000 and $ 99,999 per year whereas the other half has less than $ 20,000. The per capita income is $ 17,613 which alone indicates a rather poor area but nevertheless there are people with a higher income. So probably the households with the higher income consist of fewer persons than the ones with the lower income.
- Parts of the downloaded data are sample data, which means that is does not represent the highest possible accuracy. "Summary File 3 presents detailed population and housing data (such as place of birth, education, employment status, income, value of housing unit, year structure built) collected from a 1-in-6 sample and weighted to represent the total population."
- Trouble concerning the creation of this web pages were caused by the graphic file formats. The maps I had created in IDRISI had to be saved in Bitmap-Format (*.bmp), but this format cannot be used for presentations over the Internet so I had to change it either to the Graphic Interchange Format (*.gif) or the JPEG File Interchange Format (*.jpg / *.jpeg). Both have advantages and disadvantaged. Unfortunately both proofed the latter in combination with some of my maps. As I will show below the *.jpg-maps provide true colours but they are more or less blurred whereas the *.gif-maps are sharp but destroy the chosen colours. Example:
Therefore I have used different formats, depending on how the maps were displayed in which format. Especially the raster maps of the ethnicity distribution were of poor quality in both formats, so that I decided to display them as vector maps which has improved the quality a lot.
- Problems concerning my analysis are based upon the size of the census tracts. Some are really very small whereas others are relatively huge. That makes it difficult to compare the relevance of the results achieved with the Boolean approach.
- The most annoying problems were software based. Both IDRISI and Netscape Composer created a lot of unnecessary, illogical, and in particular time-consuming problems. When you keep on repeating the same steps and sometimes you get the desired results and sometimes not, you can only ask yourself: " WHY? ". The inability of IDRISI to connect a raster map with an attribute table forced me to connect and export every single attribute values file and assign it to my basic raster map in order to create the maps I wanted to have. The features IDRISI has which Arc View does not have were not needed for my project. Finally I can say that it would have saved my a lot of time and work if I had been allowed to prepare my project in Arc View rather than in IDRISI. - Netscape Composer is a rather simple program that is easy to learn. But because of its simplicity it also lacks several features which I consider standard, e.g. drag and drop text to another location. Moreover the program proves to be very unstable. It often crashed only when I tried to change text into italics . As you can imagine this is a tough trial to one's patience.
- Due to limited time and also because it was not explicitly demanded, I have not created a cartographic model for my whole project. That would have been too time consuming because I had not had the time to work myself into a new program like Freehand or something similar (unfortunately MS Word is not available in our SIS-Lab) in order to create a rather minor image.
-
Another problem that became obvious not before I had posted my web pages
is caused by different monitor sizes. My web sites are best displayed on
a 17'' monitor. When you browse to it with a smaller monitor the structure
will no be displayed as I have meant it to be, e.g. the three ArcView images
on the Methodology
site are not grouped together but instead the third is placed below the
others. This is a problem I have to live with. I am not going to change all
my pages because of that problem
, especially because 17'' monitors are becoming standard and probably no
one beside the instructor, other students, and my friends and family will
ever see these sites.
-
One more problem that really annoys me: the spell checker of Netscape Composer!
First of all I thought it has been my mistake, but after this
nasty little bugs heaped up I came along that you should avoid using it.
Despite its welcomed ability to find spelling mistakes it also
felt free to add unwanted letters or to change the order of my
words! Unbelievable, but unfortunately true!
- To sum it up, I have to say that this project demanded a lot of work, effort, initiative, and last but not least patience in order to complete it. I am happy that it is done now and -as I must admit- a bit proud of myself for having created my first web page!

BACK to Project