At the end of his presentation, Brad mentioned that he always needed extra help with his projects, and if anybody was willing he would supply them with work. When I approached him he mentioned that he would like to develop a tool that could allow the public to enter their own stream data online through the use of a form and a dynamic mapping atlas. Seeing the opportunity to gain web publication, dynamic database, and web GIS skills, I jumped at the opportunity to help him by turning the development of this tool into my Geog-355 project.
To give a better understanding of how this tool works, here is a typical example of when and how someone would use the tool:
A grad student is doing fieldwork for his thesis on salmon spawning in tributaries near developed areas. Water quality data is a major component of his thesis, so he takes several measurements of the stream and records them, and then carries on with his other work.
When he gets back home he goes to the SHIM site. He navigates to the Stream Observation Entry Atlas, where he is presented with a map of BC. He navigates to the location he collected the data, and as he zooms in more and more he crosses thresholds that supply him with more detailed data themes. One he finds his location, he selects the "digitize a point" tool, and clicks on the exact location. Immediately a form pops up that requests information about the stream such as pH, water temperature, air temperature, turbidity, the date and time the information was collected, etc.
When he is finished entering data he presses the submit button, and the data is immediately sent to the SHIM server where it is placed in a database. The data is added as a record in the database, where each record represents a point in the "stream observation" theme. Since the map is dynamic, the "stream observation" theme is immediately updated and when the student returns to the map his point is there for him to see.
As he carries on with his thesis, he takes measurements at the same point once a week. Each time he goes back to the SHIM site and adds more data to the existing point.
When his thesis is complete, he is interested in what types of trends are occurring in each of the variables he has been measuring. He navigates to his point on the map that he has been continually updating, and highlights it. He then clicks on the report button, and a page pops up that lists all of the data collected for that point by all users. When requested, a graph is produces that shows variation over time. This will be very valuable for his thesis.
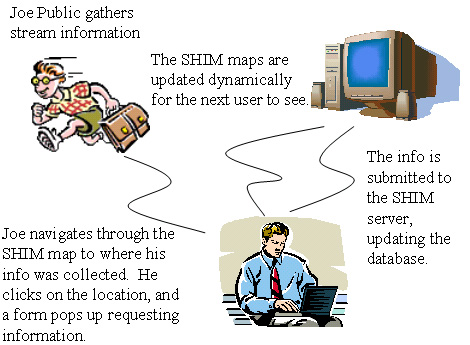
Creating this tool was my challenge for this project. Below is a diagram of how information is communicated between user, server, and map.

When speaking with Brad, he mentioned he had done some research to see if anything like this had been done before and didn't come up with much,so it was basically up to me to figure out how to go about creating such a tool.
Before I went about designing my methodology, I had to know what kind of data I was collecting. I did some internet research, spoke to Brad, and talked to some people from Environment Canada and the Pacific Streamkeepers Federation, and came up with the following variables:
| Organization Name | |
| First Name | |
| Last Name | |
| Phone Number | |
| Survey Date | |
| Survey Time | |
| Stream Name or Nearest Town | |
| Point Location Description | |
| Weather | |
| Turbidity (cm) | |
| Air Temperature (Celsius) | |
| Water Temperature (Celsius) |