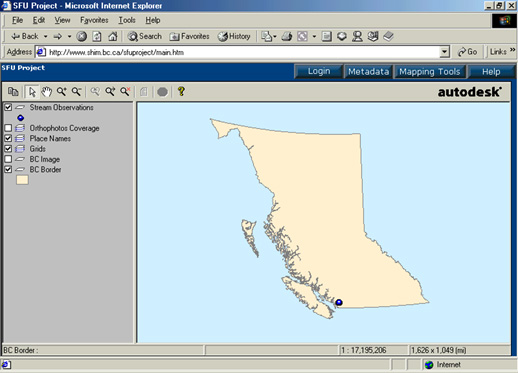
As you can
see the setup looks a lot like ArcView, and just like ArcView it is quite
easy to use. Starting from here, a user would zoom into where they
would like to enter data using the supplied zooming tools. When they
are zoomed in far enough (they must cross a threshold scale of 1:100,000),
they can click the ![]() button to
find the stream observations entry tool.
button to
find the stream observations entry tool.
Once the "Mapping Tools" button has been selected, the user has the following tool bar to work with:
![]()
With this toolbar, the user can select the green circle button to digitize a new point, the X button to delete a point, or the report button (looks like a piece of paper) to view data entered at an existing point. The question mark button brings up available MapGuide help.